BEST NC Launches Updated per Pupil Expenditure Data Explorer
The latest update now includes data through the 2021-22 academic year.
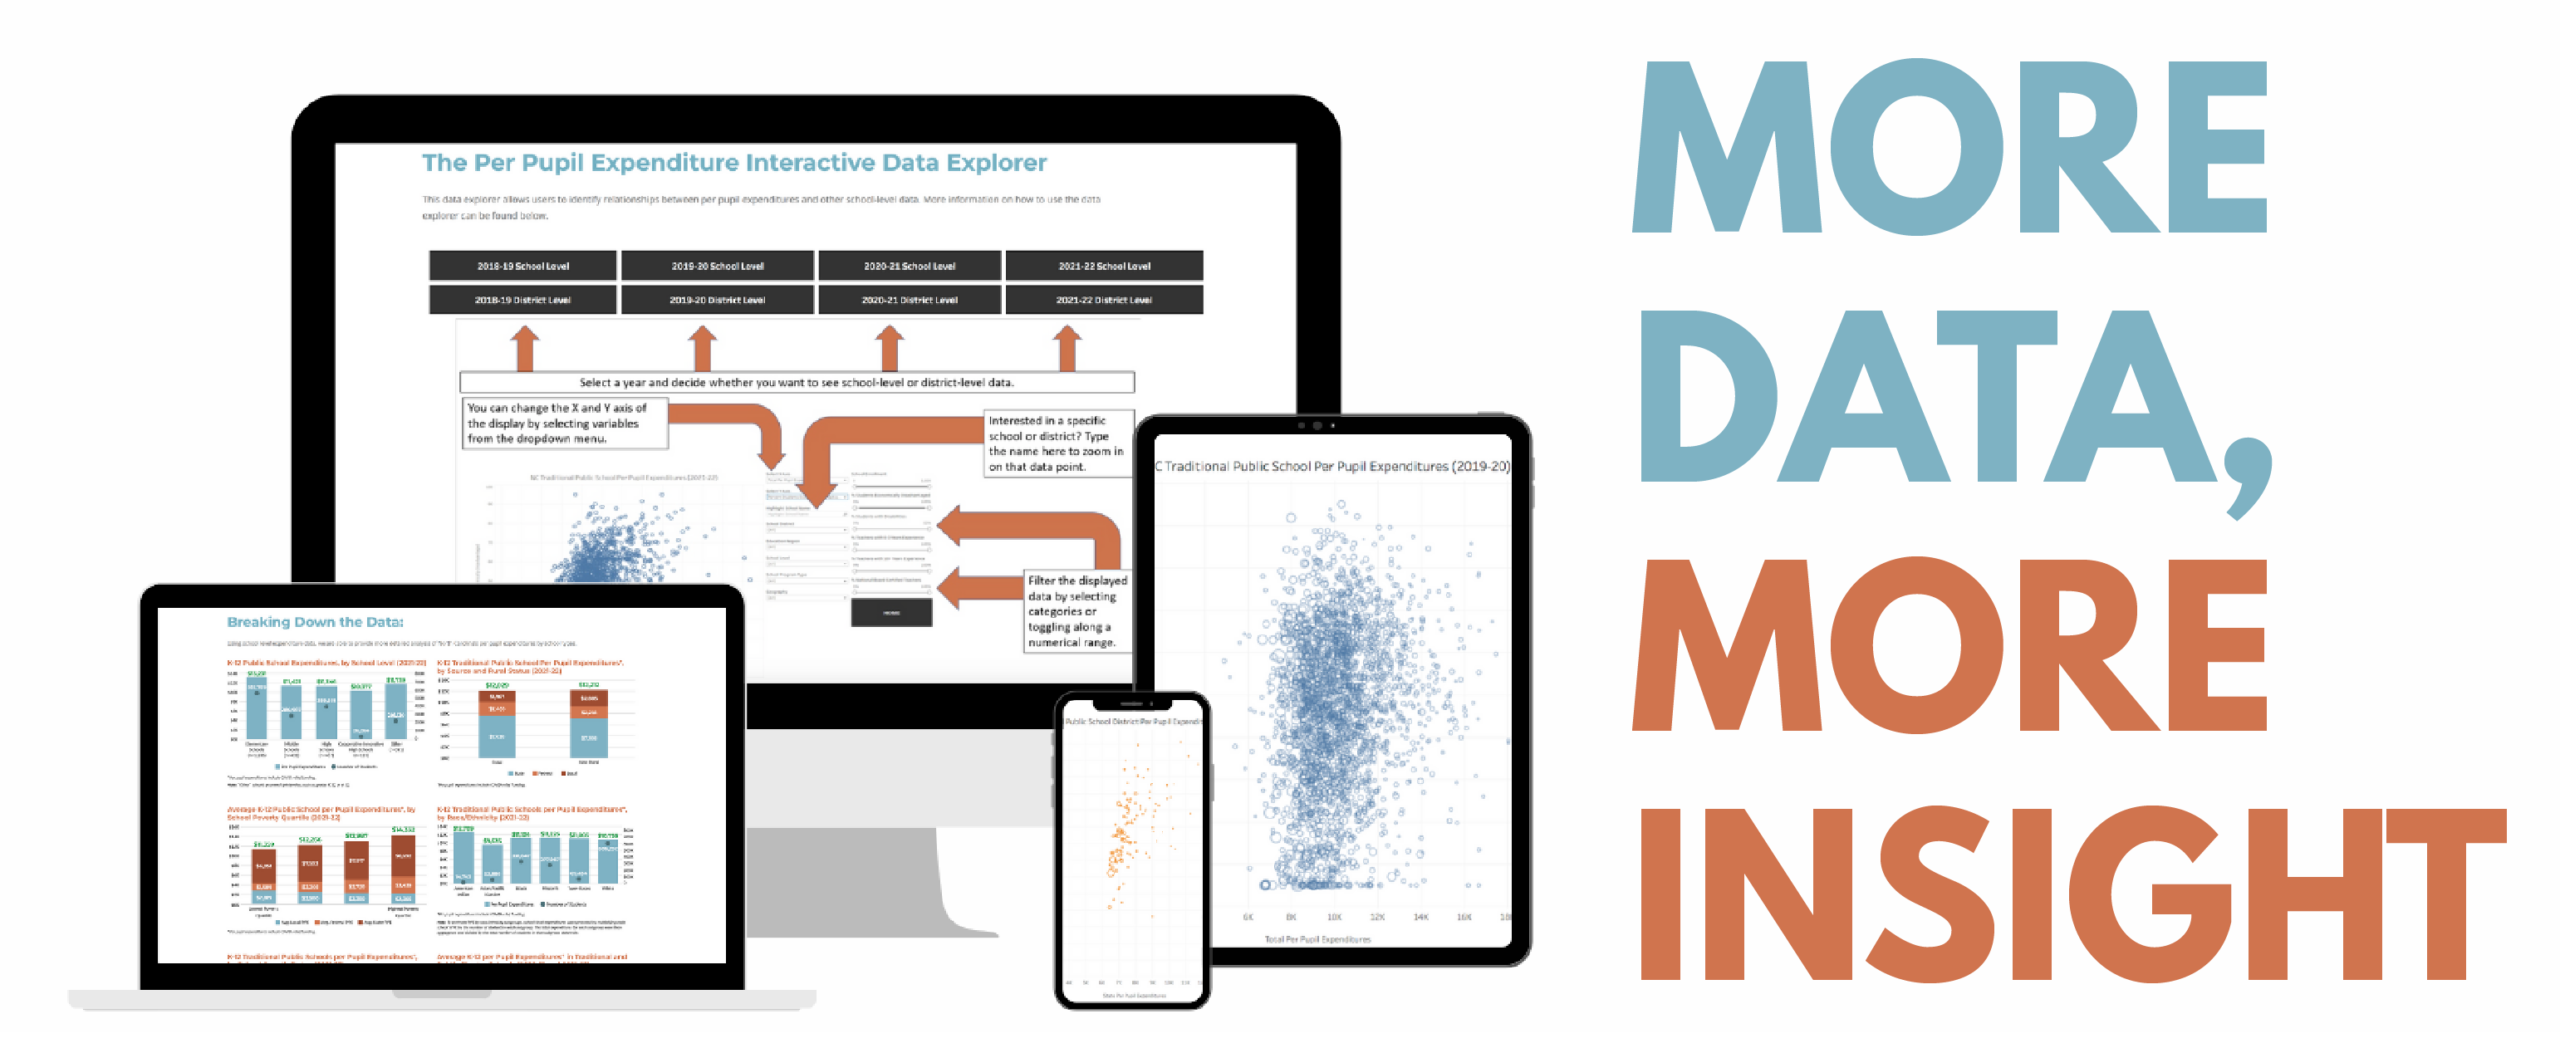
BEST NC is pleased to announce the 2023 update of its per Pupil Expenditure (PPE) Data Explorer and landing page, designed to facilitate the understanding and exploration of North Carolina’s school-level spending data and its relationship to other key education indicators.
The updated tool features school- and district-level expenditure data from the 2018-19 through 2021-22 school years, including both traditional public schools and public charter schools. The tool offers the ability to examine longitudinal changes in spending and school performance at the school and district levels.
ABOUT THE TOOL
The federal Every Student Succeeds Act of 2015 requires each state education agency to release school-level per pupil expenditure data. 2018-19 expenditure data was released in 2020 marking the first time spending data were made available at the school level in North Carolina and uncovering trends that have been masked by district-level data.
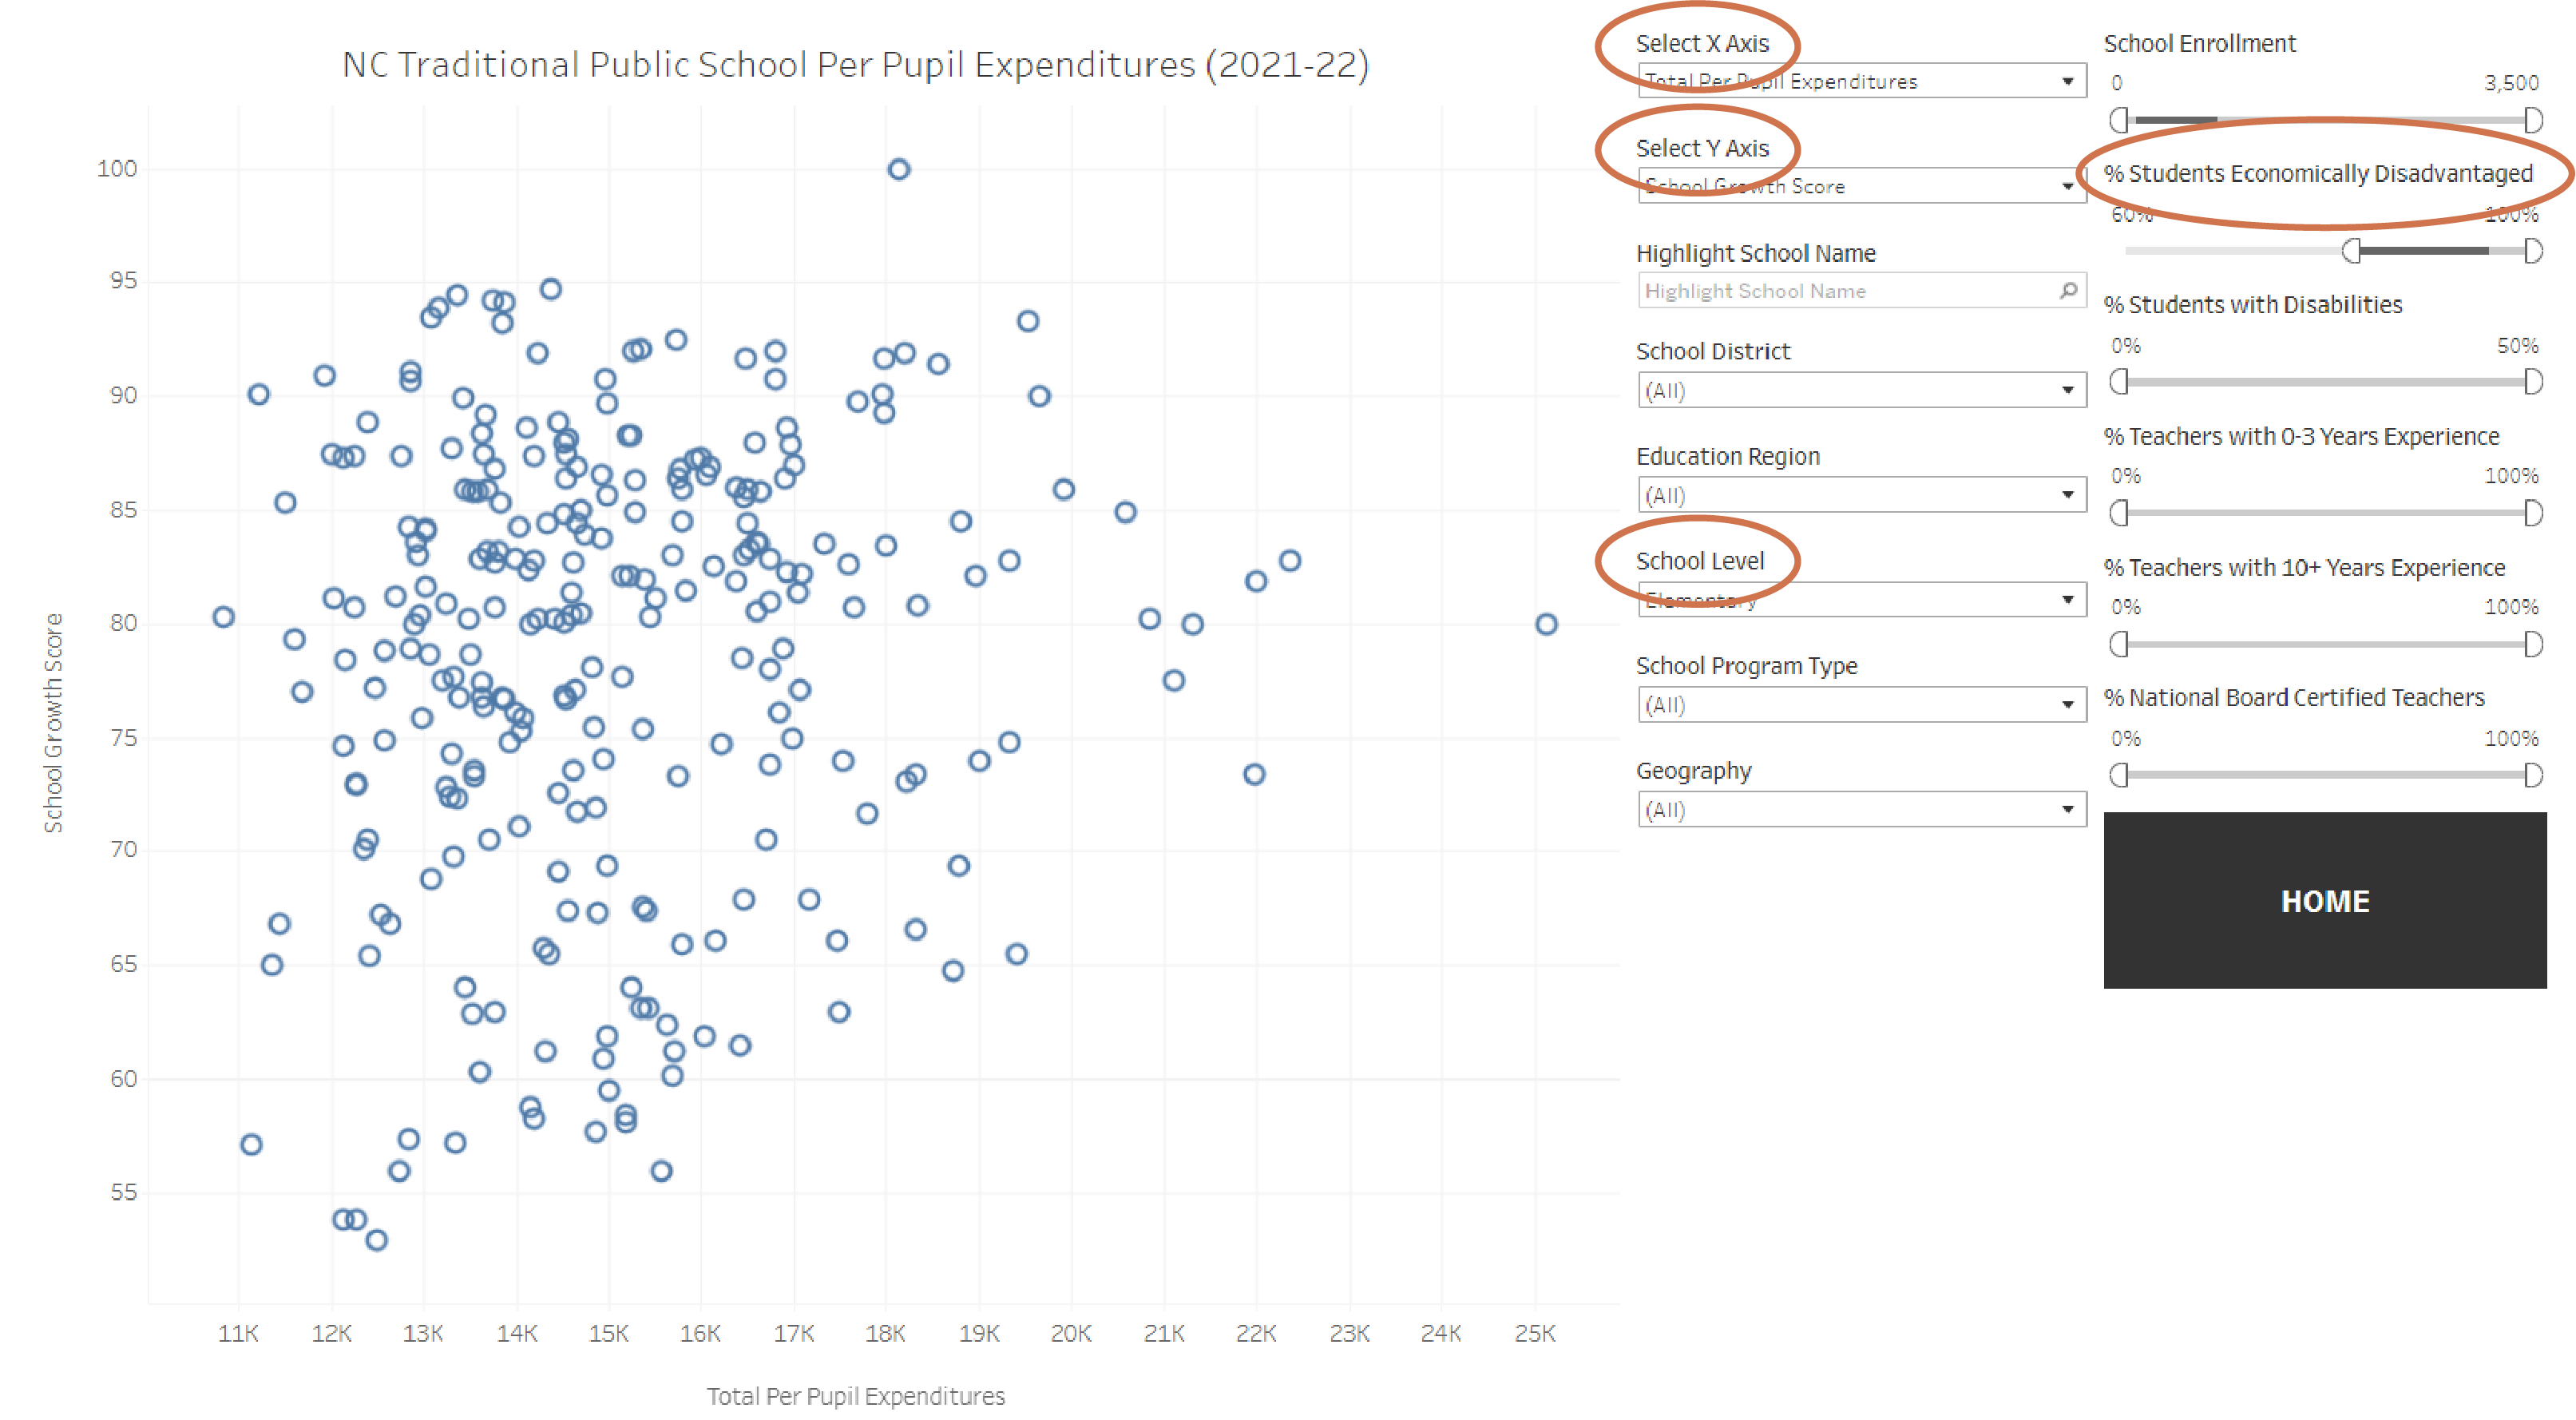
BEST NC’s web-based Per Pupil Expenditure Data Explorer allows education stakeholders to explore per pupil funding trends across individual schools, within districts, and across districts in North Carolina. Educators, school leaders, parents, policymakers, advocates, and other members of the public can use this tool to examine education spending and student outcomes for similar schools based on size, grade level, geography, percent students with disabilities, poverty, and more.
By comparing schools with similar characteristics, school leaders and other education stakeholders can identify schools with strong student performance, given their level of funding and the characteristics of their student body. Promising or innovative practices from these schools might then be examined to help improve teaching and learning in similar schools.
For example, users can narrow the analysis to include all elementary schools where at least 60% of students qualify as economically disadvantaged, and then examine schools with strong student growth numbers and modest per pupil expenditures.
 Note: Student performance metrics are unavailable for the 2019-20 school year, as all end-of-year tests were canceled due to the COVID-19 pandemic. Additionally, in 2020-21, students took end-of-year tests, but North Carolina was granted a waiver from federal accountability requirements, meaning that while student proficiency numbers were available other school-level metrics – such as School Performance Scores, School Achievement Scores, and School Growth Scores – were not. In 2021-22, student- and school-level performance metrics are available and included in the Tool.
The PPE Interactive Data Explorer can be accessed on BEST NC’s PPE landing page alongside summary analyses (see below) and additional resources.
INSIGHTS AND TRENDS FROM THE PER PUPIL EXPENDITURE DATA EXPLORER: KEY FINDINGS ABOUT NORTH CAROLINA’S PUBLIC SCHOOLS
With the help of BEST NC’s Per Pupil Expenditure Data Explorer, education leaders and other stakeholders can explore trends in school spending at the school level. Several insights are highlighted on the PPE landing page. Examples of these findings can be found below.
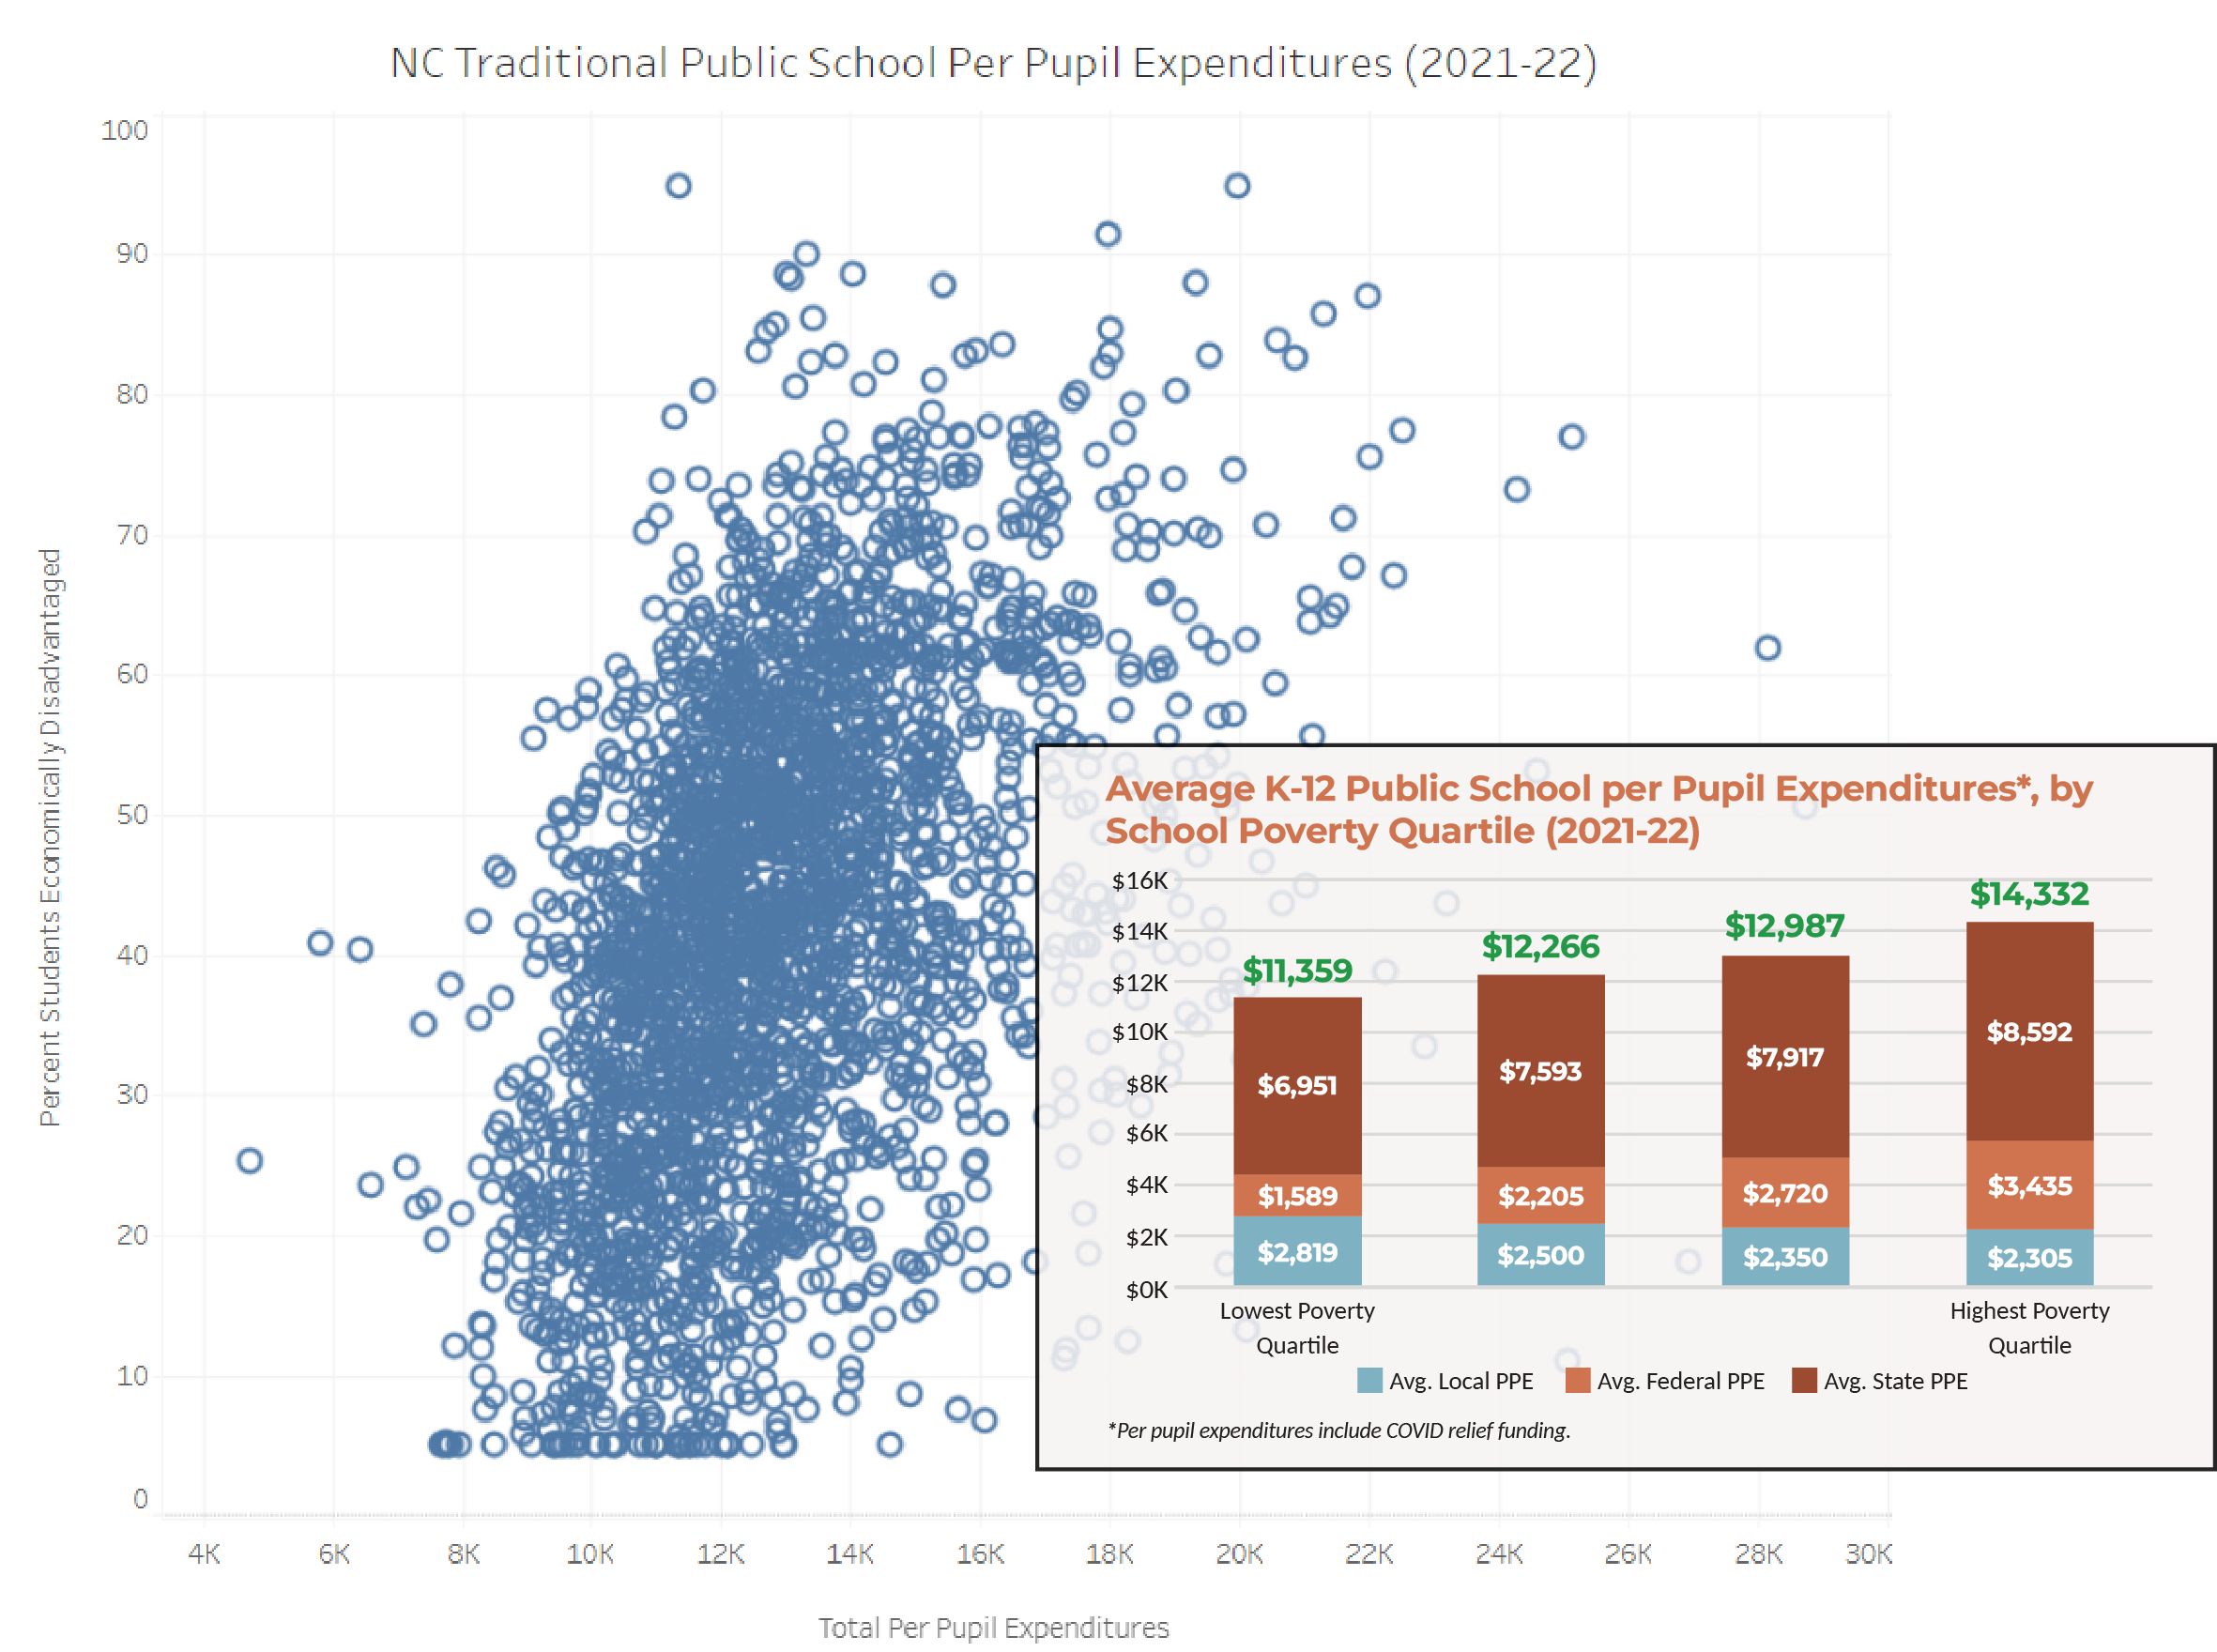
Per Pupil Expenditures and Economically Disadvantaged Students:
Generally, total per pupil expenditures in North Carolina are higher in schools with greater numbers of economically disadvantaged students. In 2021-22, about $3,000 more was spent per pupil in schools in the highest-poverty quartile, as compared with schools in the lowest-poverty quartile. In a school with 500 students, this equates to around $1.5 million in additional resources. In this way, North Carolina defies national trends in which lower income schools generally receive less funding than more affluent schools. It should be noted, however, that a relatively equitable distribution of education funding does not mean that overall funding levels are necessarily adequate.
 Source: NC DPI School Report Cards
Note that expenditures of local funds are inversely correlated with poverty (see graph above), so funding equity in most districts is a function of state and federal funding allocations.
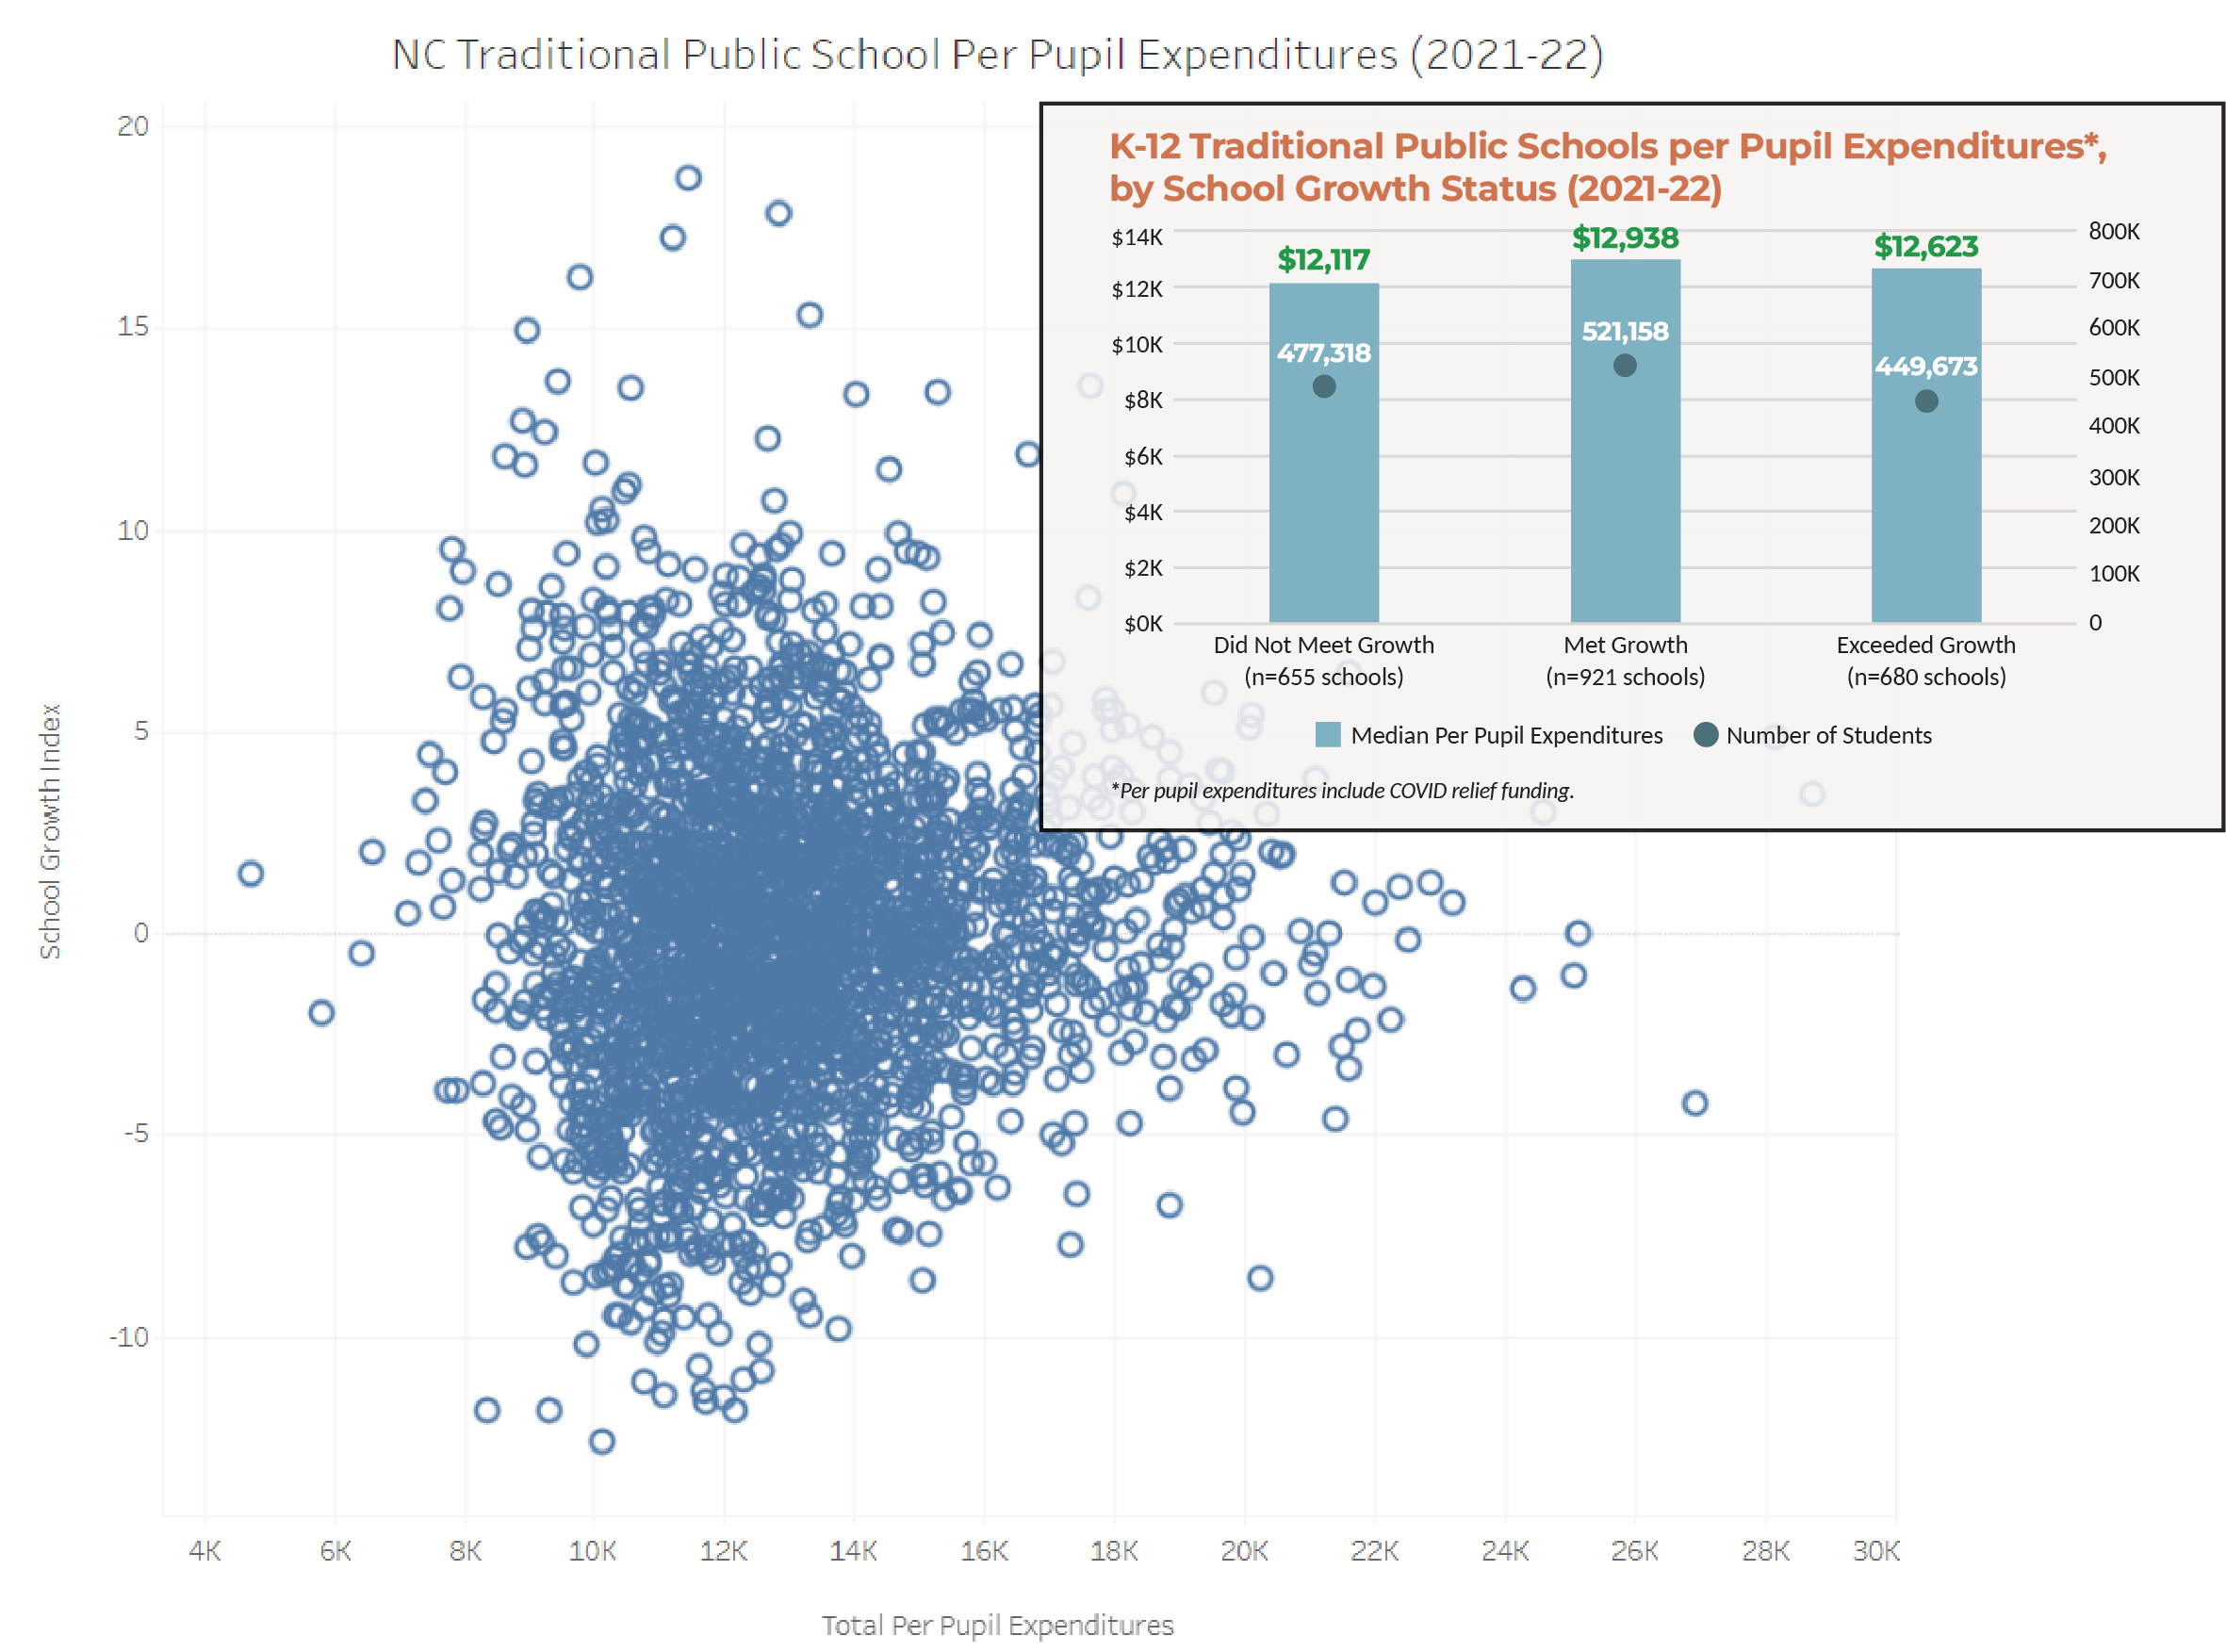
Per Pupil Expenditures and Student Performance:
Schools with lower student achievement have higher per pupil expenditures than schools with lower student achievement. These differences are driven by higher levels of state and federal funding.
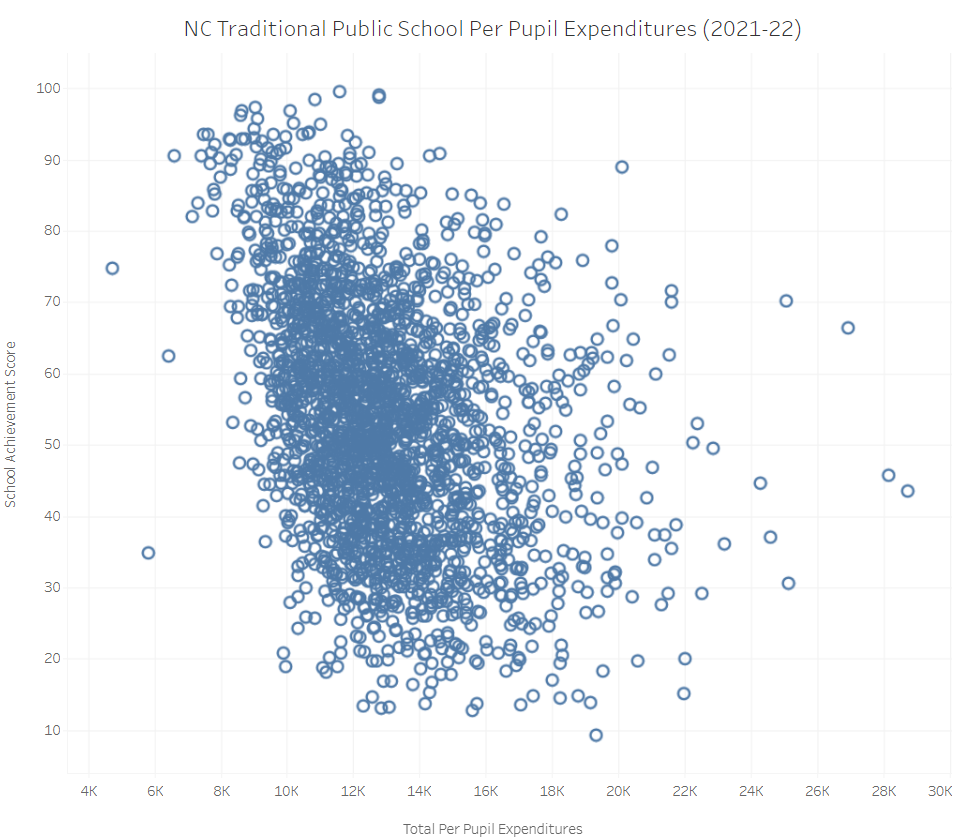
Meanwhile, there appears to be little correlation between levels of student growth and total per pupil expenditures.
 Sources: NC DPI School Report Cards; NC DPI School Performance Grades
.
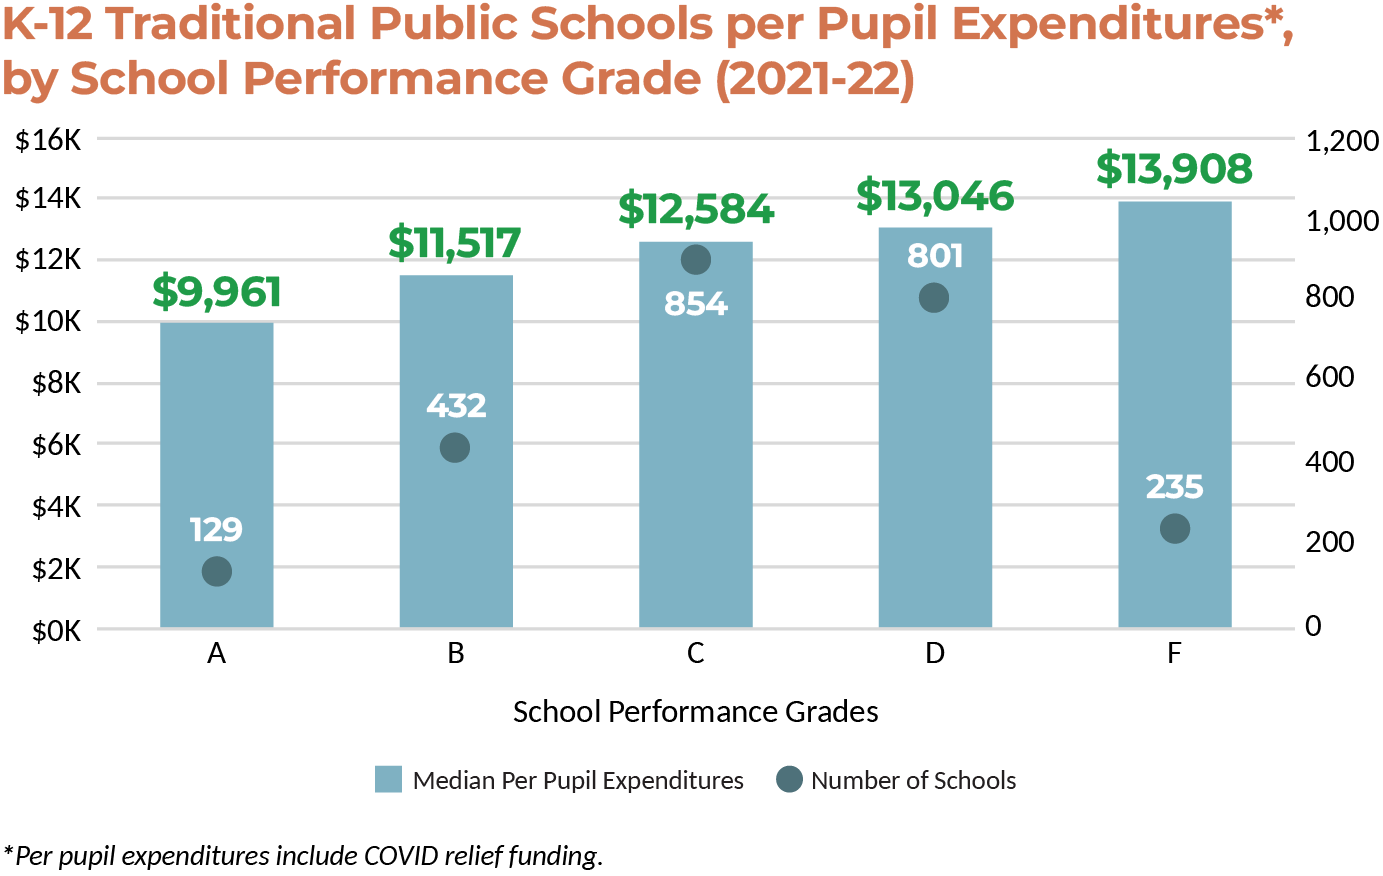
Because School Performance Grades (SPG) are driven mostly by student achievement and per pupil expenditures are higher in schools with lower achievement, when per pupil expenditures are sorted by SPG, the highest per pupil expenditures are seen in schools with a SPG of D or F.
 Sources: NC DPI School Report Cards; NC DPI School Performance Grades
Impact of COVID Relief Funding on Total Per Pupil Expenditures:
Total per pupil expenditures (including state, federal, and local funds) increased by $2,480 per pupil, or 25%, over the four-year period from 2018-19 to 2021-22. Fifty-eight percent (58%) of this increase was due to an influx of federal COVID relief dollars.
Since March 2020, North Carolina’s K-12 public schools have received over $6 billion in COVID relief funds, mostly from the federal government. Schools and districts spent $90 million in COVID relief funds during the 2019-20 school year, $660 million during the 2020-21 school year, and over $2 billion during the 2021-22 school year. Schools have until September 30, 2024 to spend the remaining COVID relief dollars.
While COVID relief fund expenditures are not available at the school level, district-level data reveal that more COVID relief funds were spent by districts with higher percentages of students identified as economically disadvantaged. This is because COVID relief funding was allocated according to the federal Title I funding formula, which is designed to support schools with high concentrations of students in poverty.
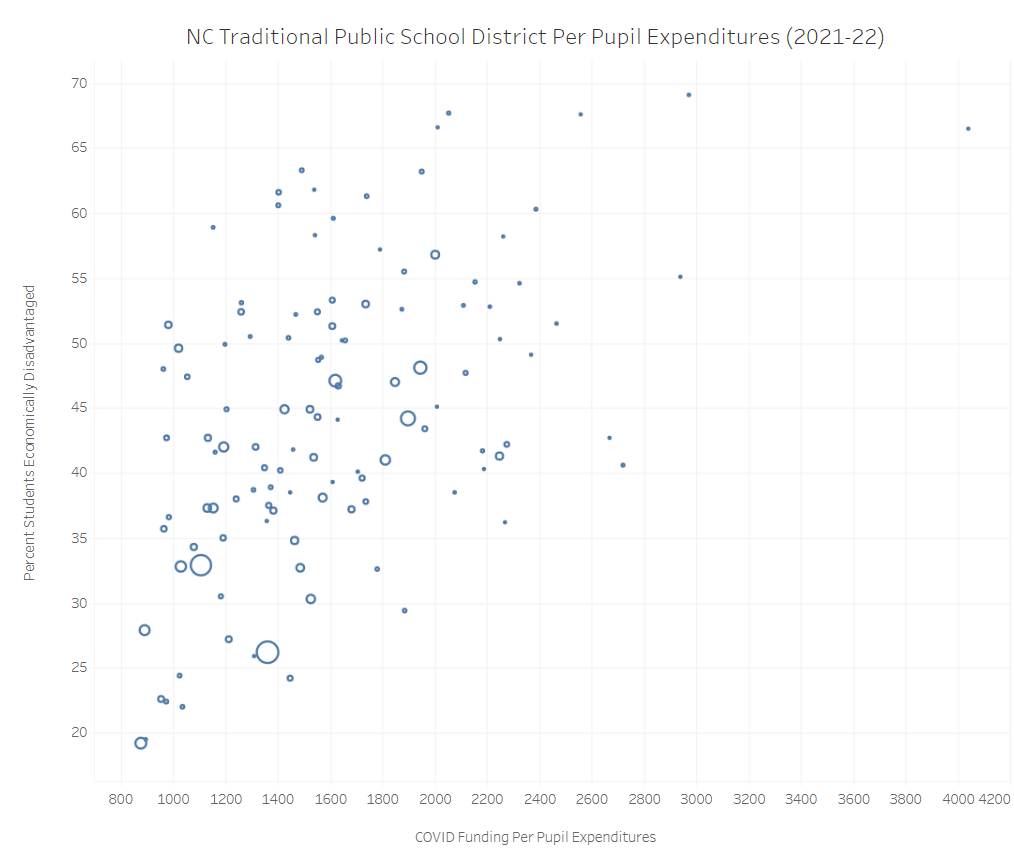
In 2021-22, districts in the highest poverty quartile had 54% higher COVID relief funding expenditures, per pupil, than districts in the lowest poverty quartile.
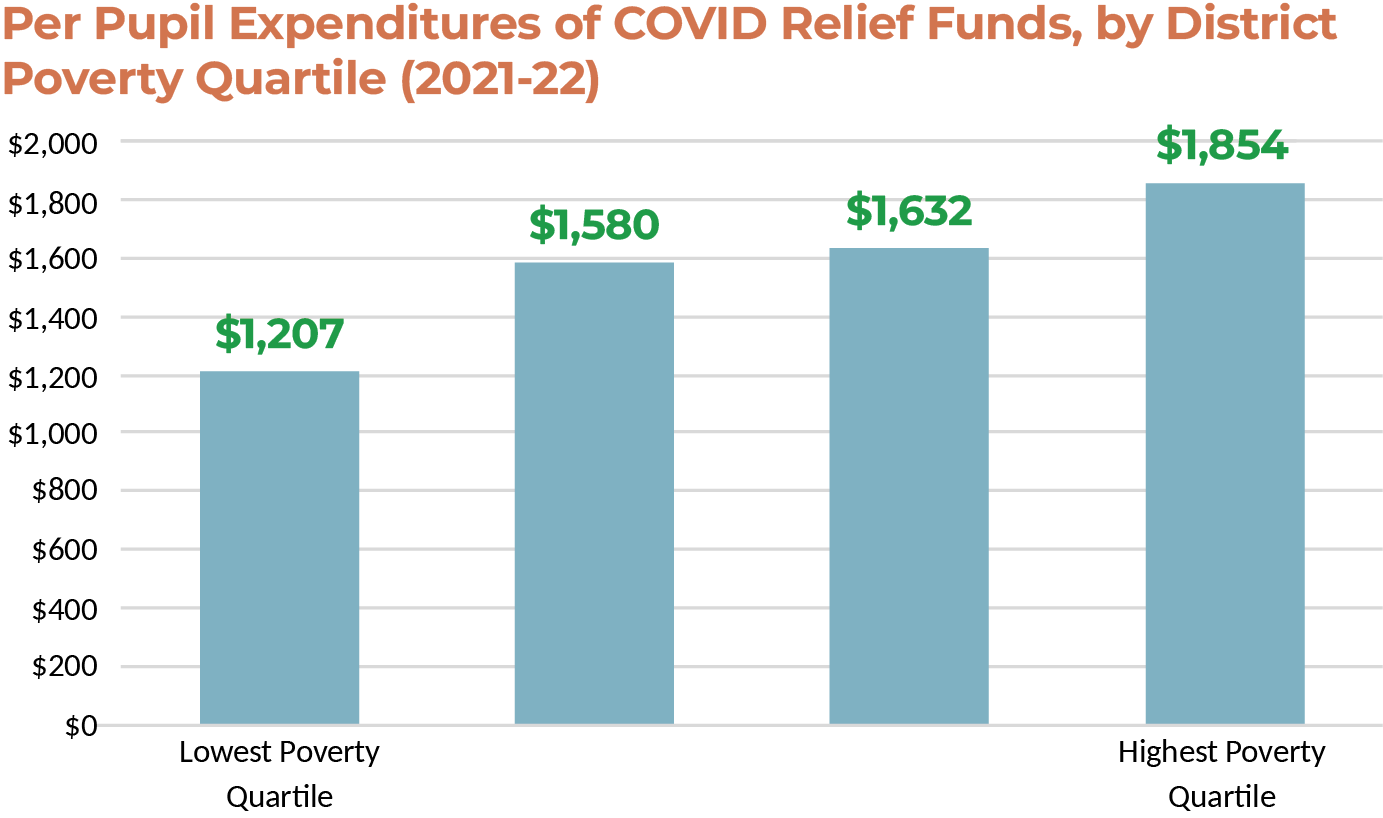 Sources: NC DPI School Report Cards; NC DPI COVID Funds
.
Per Pupil Expenditures in Traditional Public Schools and Public Charter Schools:
In 2021-22, average per pupil expenditures were $12,215 in traditional public schools and $11,233 in public charter schools. The difference in funding in 2021-22 ($982 per pupil) is 47% lower than it was in 2020-21 ($1,859 per pupil). Part of the difference in funding between charter schools and traditional public schools may be attributable to traditional public schools having slightly higher percentages of special education students (13% vs. 11%) and higher percentages of economically disadvantaged students (38% vs. 32%) than public charter schools. As a result, public charter schools may receive less federal funding through Title I (students in poverty) and IDEA (special education).
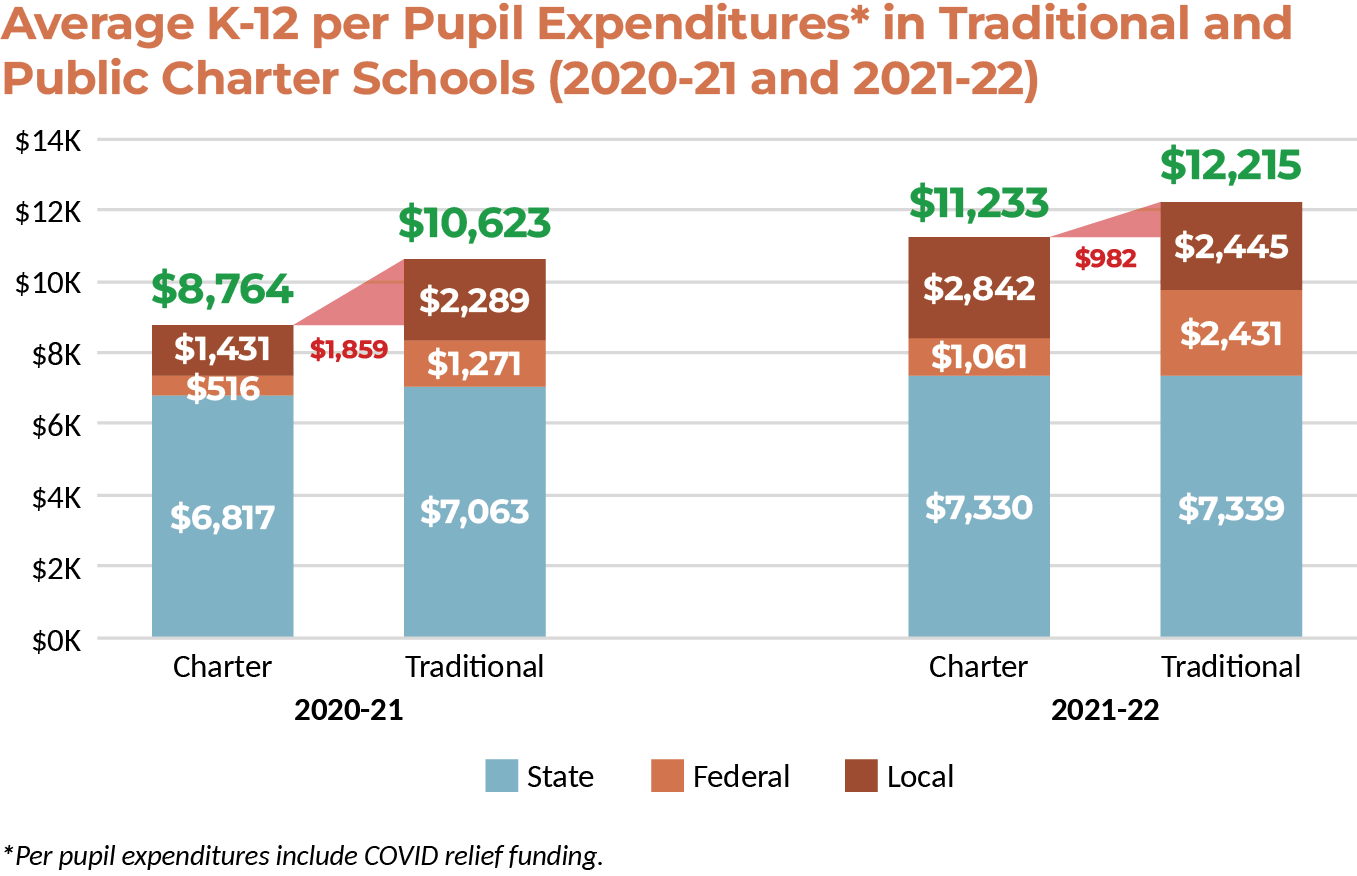 Source: NC DPI School Report Cards
.
Per Pupil Expenditures in Rural and Non-Rural Schools:
Rural schools in North Carolina (as identified by the U.S. Department of Education) spent about as much, per pupil, as non-rural schools in 2021-22. Local funding for rural schools was lower than non-rural schools by 32%, but state and federal funding for rural schools is higher than in non-rural schools by 7% and 10%, respectively, making up most of the difference in per pupil funding. North Carolina has the second largest population of rural students in the country, behind only Texas.
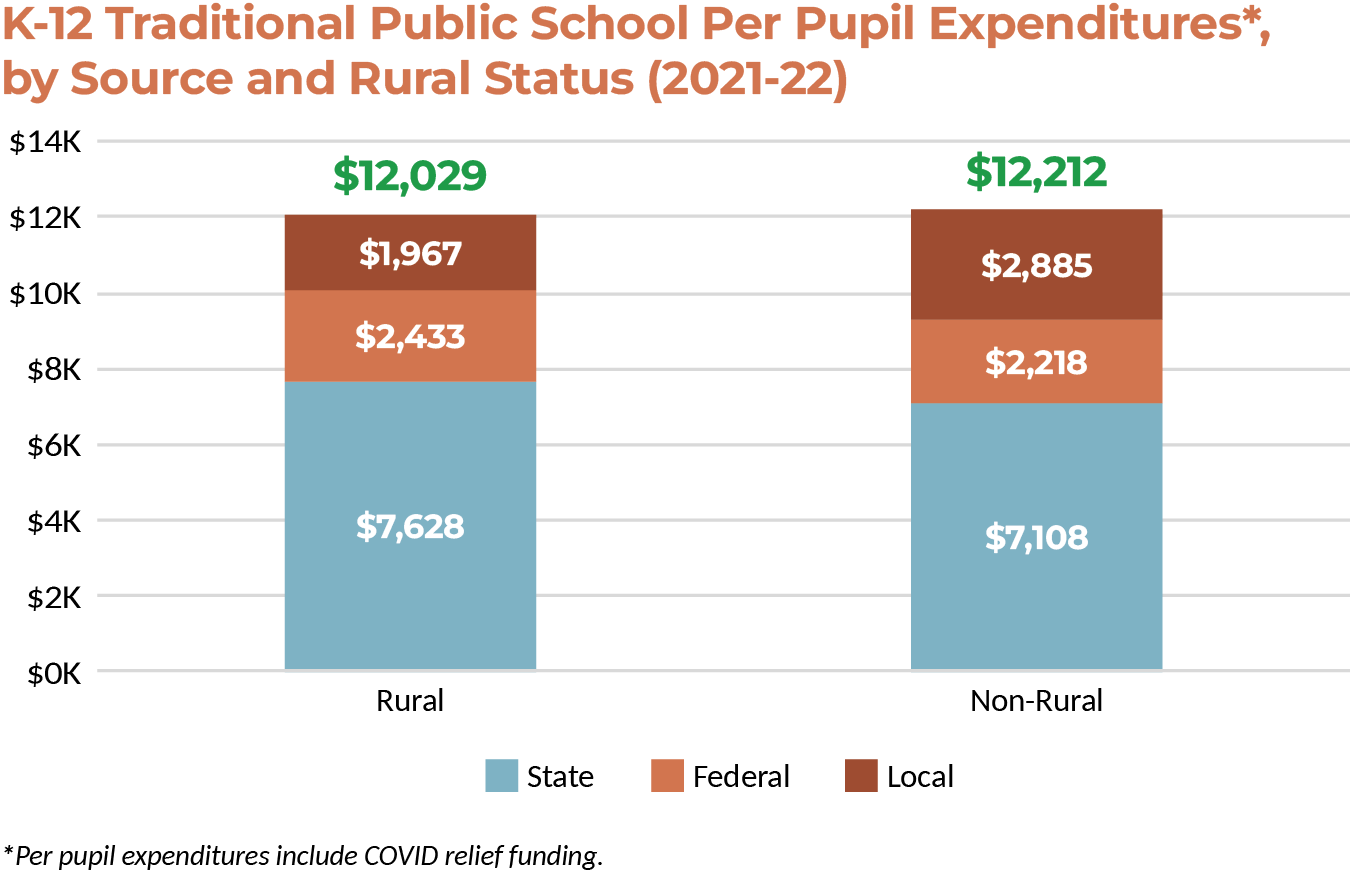 Sources: NC DPI School Report Cards; NC DPI EDDIE DATABASE
Per Pupil Expenditures by Race/Ethnicity:
By prorating school-level per pupil expenditures at the school level according to the proportion of students in each racial/ethnic subgroup, it is possible to calculate per pupil expenditures by race/ethnicity. In 2021-22, per pupil expenditures were highest for American Indian students, and lowest for Asian-Pacific Islander and White students. Race is not directly a factor in North Carolina’s school finance laws; however, schools and districts with greater percentages of economically disadvantaged students receive additional funds to educate those students (see page 46 of our 2023 Facts & Figures guide for details). The per pupil expenditures seen here follow the same pattern as state-level poverty rates by race-ethnicity.
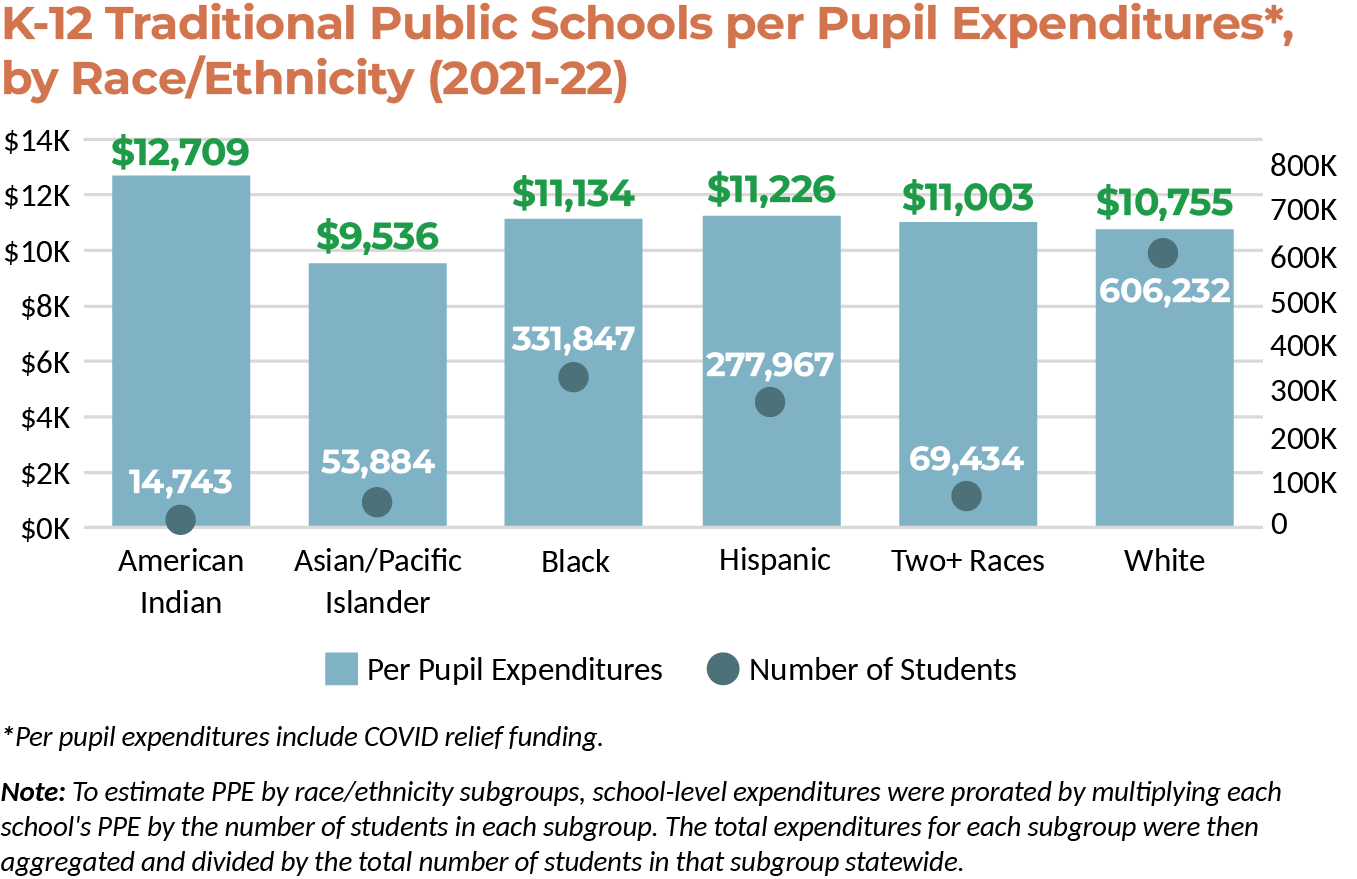 Sources: NC DPI School Report Cards; NC DPI Statistical Profile, Table 10.1
 NOTE: As with any large data set, we encourage caution in making causal assumptions. This tool is intended to be a starting point for robust conversations about best practices, wise investments, and – most importantly – how to ensure student success.