
School Spending in North Carolina
Beginning in 2019-20, the federal Every Student Succeeds Act (ESSA) requires all states to report school-level per pupil expenditures, by funding source. The availability of school-level data provides a new level of transparency for the public, educators, and policymakers and has the potential to uncover spending trends that have been masked by district-level data. BEST NC has created an interactive tool to help facilitate learning and exploration around these new school spending data.
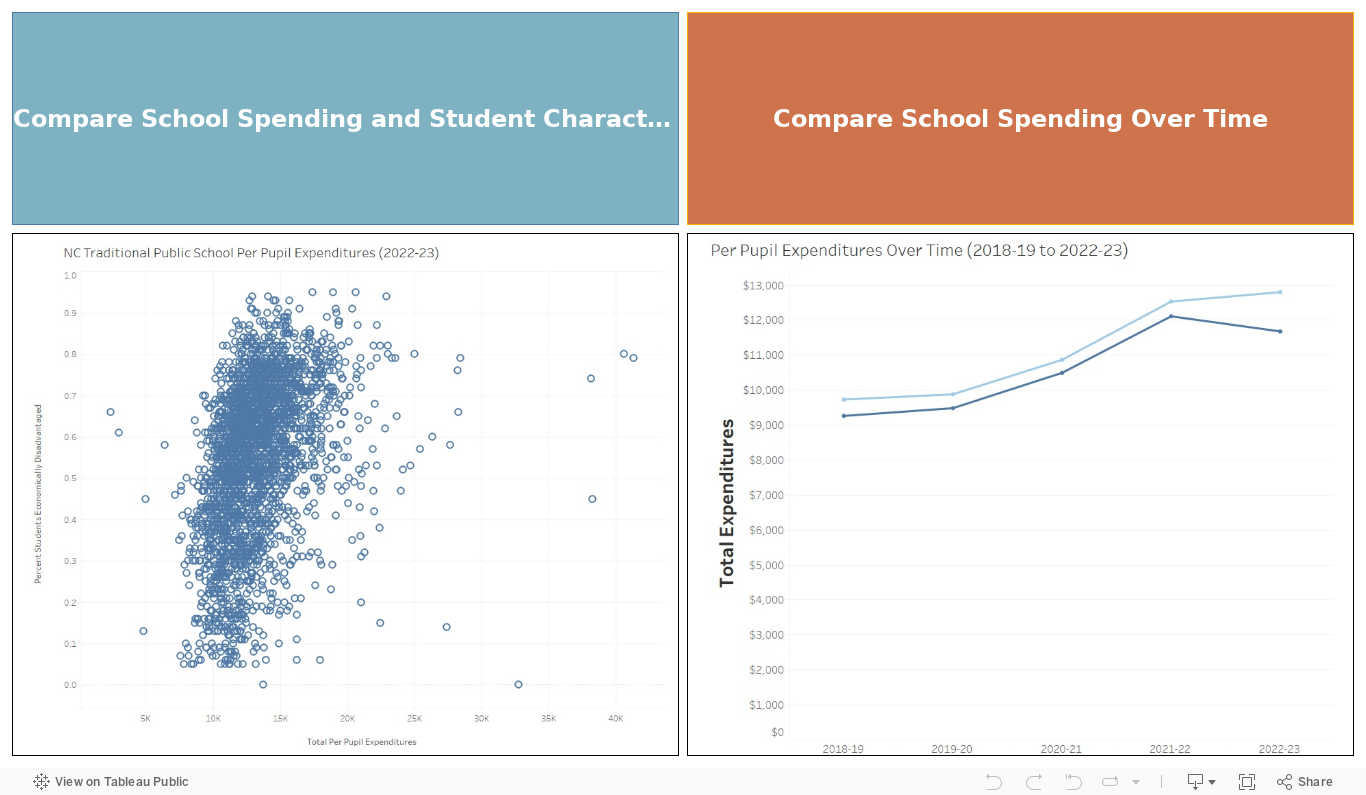
The School Spending Data Explorer
This data explorer allows users to identify trends in education spending and examine relationships between per pupil expenditures (PPE) and other school-level data. More information on how to use the data explorer can be found below.


Understanding and Using the School Spending Interactive Tool:
On the home screen above, you can choose to view a scatterplot that compares per pupil expenditures in a single year to student characteristics such as poverty, achievement and growth or to compare per pupil expenditures trends over several years. A visual explainer for navigating each tool can be found in the “How-To” documents beneath the tools and a glossary of terms used within the tools can be found below.

Note: A small subset of schools have been excluded from this data set as expenditure outliers. If you are looking for a specific school and cannot find it here, please visit the NC School Report Card page for more information. Email us at info@BESTNC.org if you have any questions.
Breaking Down the Data:
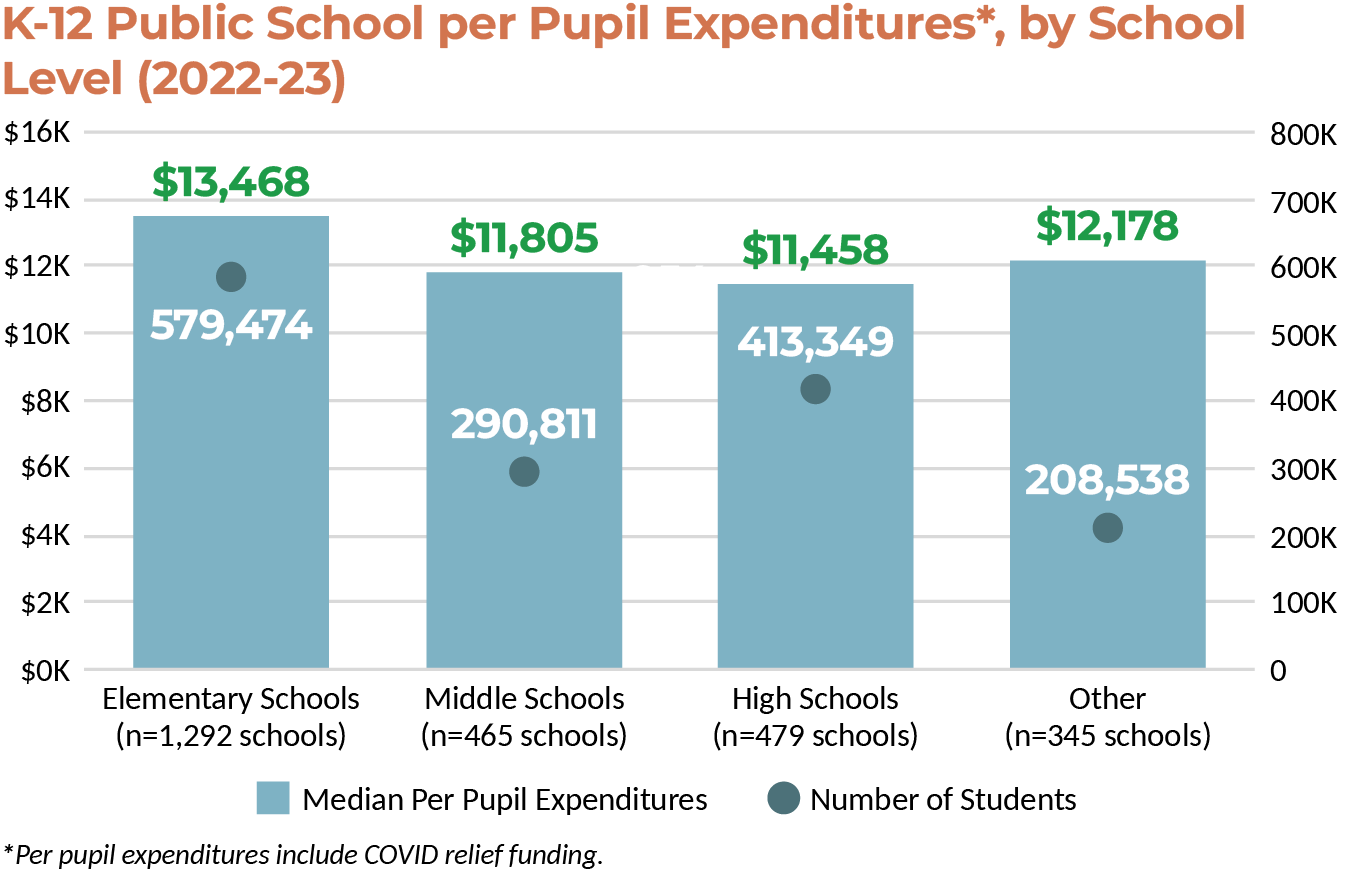
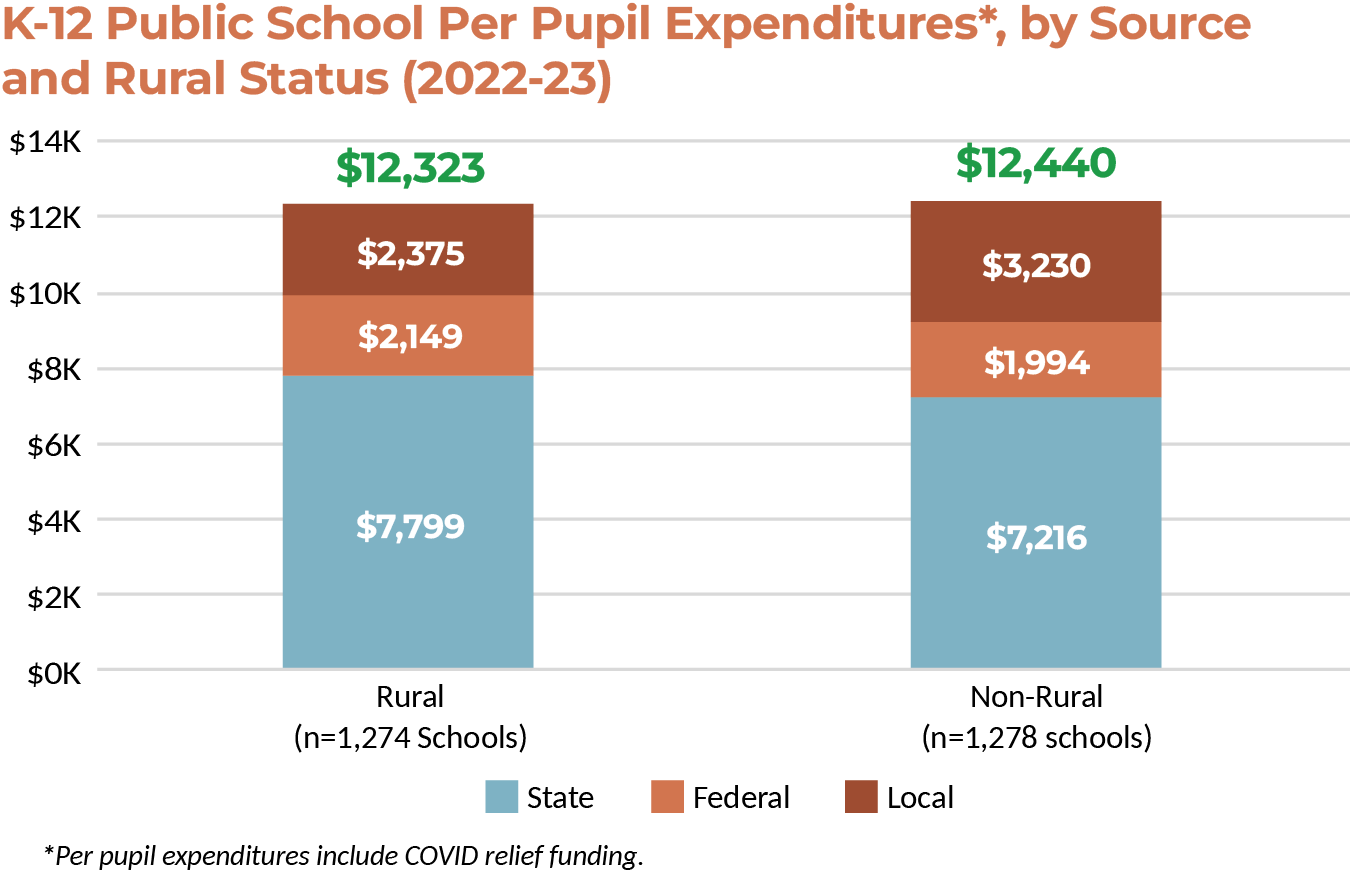
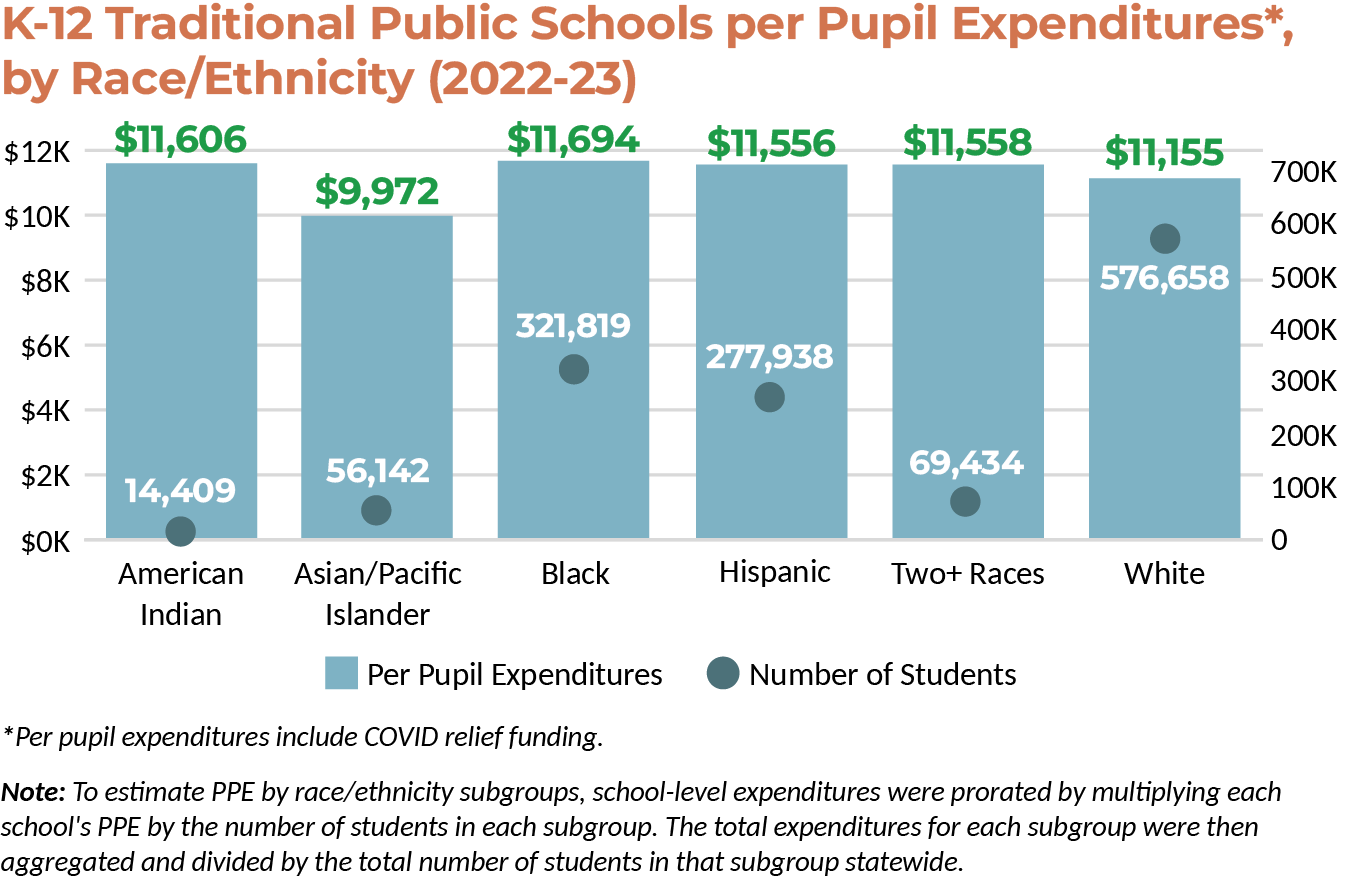
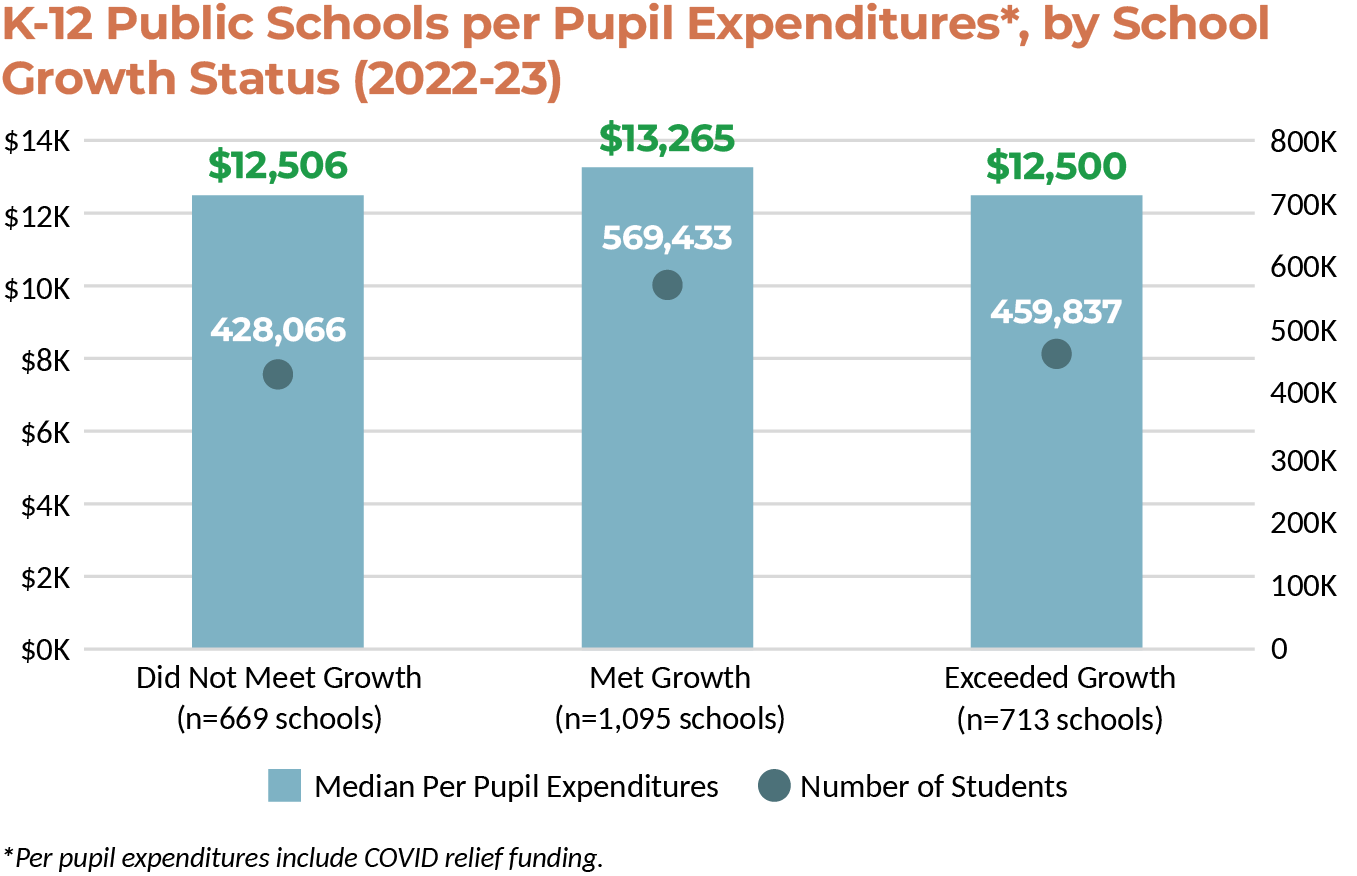
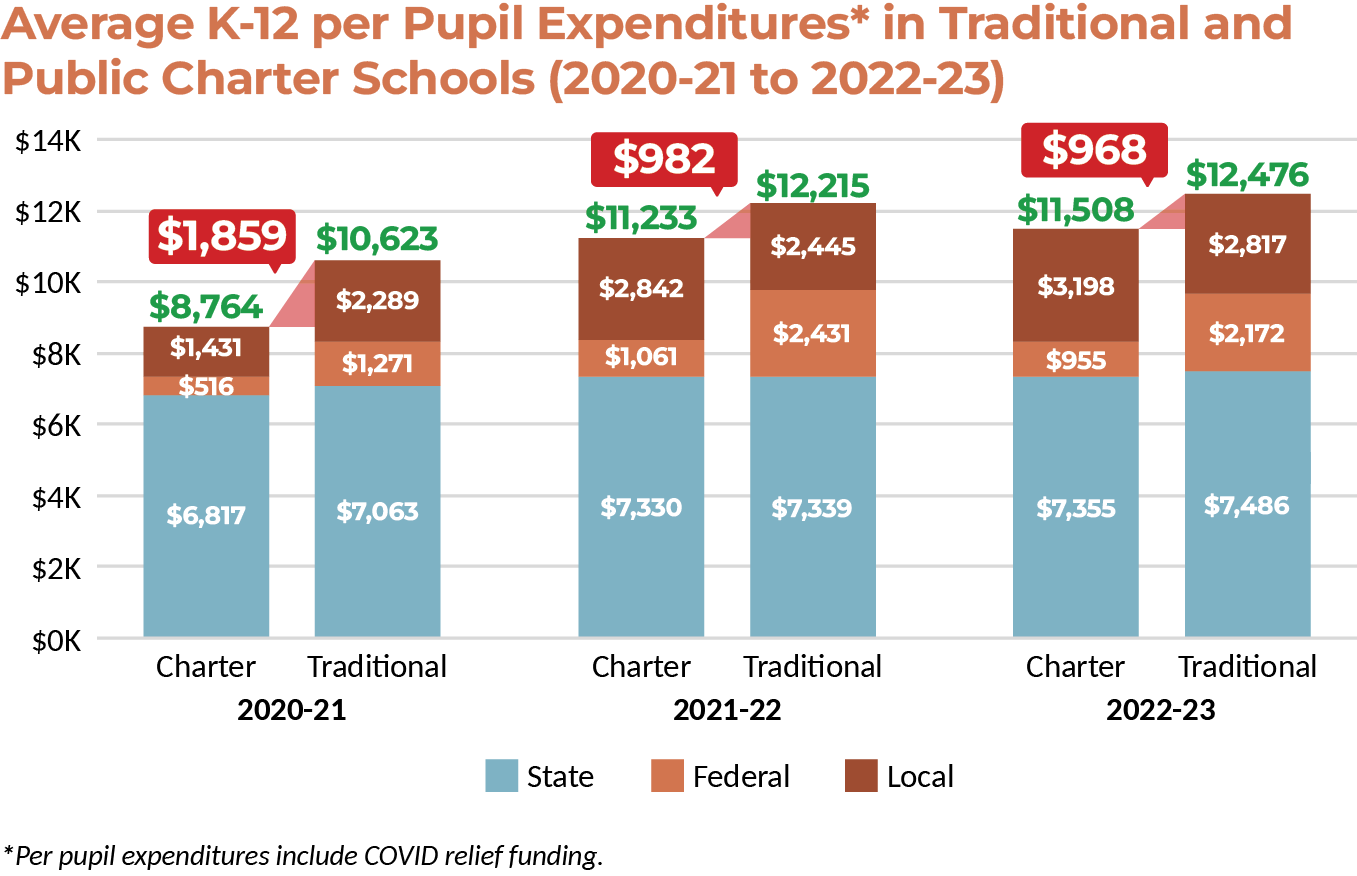
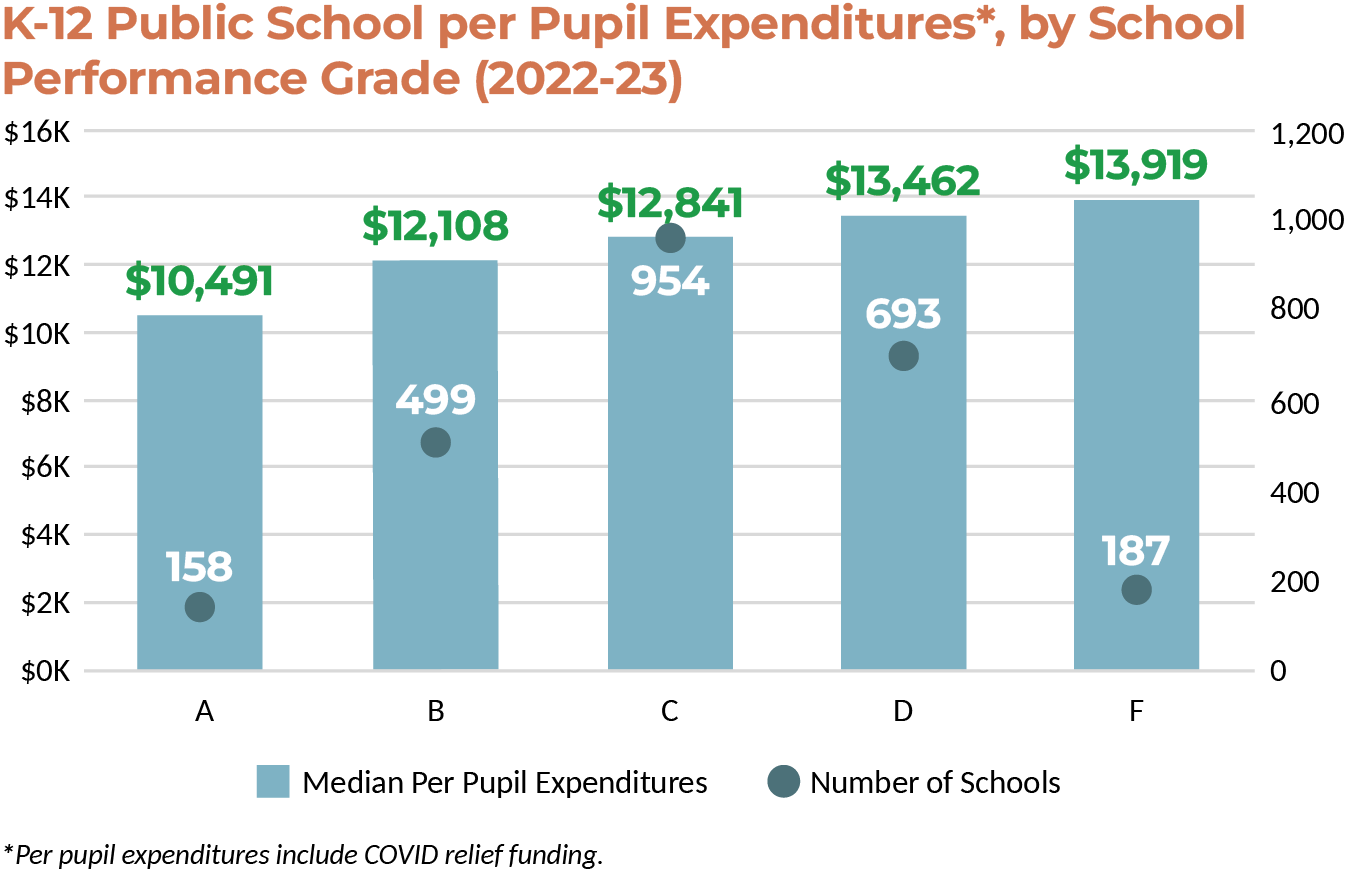
Using school–level expenditure data, we are able to provide more detailed analysis of North Carolina’s per pupil expenditures by school types.


Sources: NC DPI Educational Directory and Demographical Information Exchange (EDDIE); NC DPI School Report Card Data Set; NC DPI Statistical Profile, Table 10.1; NC DPI School Performance Grades; NC DPI COVID Expenditure and Allotment Data
Additional Resources:
- BEST NC’s School Spending Data Explorer Blog
- Download Your Free Copy Now: BEST NC’s Facts & Figures
- School and District Breakdowns: NC School Report Cards
- NC DPI Student and School Accountability Data Sets
- NC DPI School Demographic Information: EDDIE Database
- NC DPI COVID Allotment and Expenditure Dashboard