
2022 Spotlight On Series: Enrollment and Attendance During the COVID-19 Pandemic ENROLLMENT The percentage of North Carolina’s school-aged children attending traditional public schools has declined over the last 15 years, from 88% in 2005-06 to 79% in 2019-20. Meanwhile the number of students attending charter schools and homeschools has increased substantially. During the 2020-21 school year, in response to the COVID-19 pandemic, school enrollment trends experienced an accelerated shift, with homeschooling seeing a sharp uptick, and significant but less dramatic increases in private and charter school enrollment. The net result was a substantial decline in traditional public school enrollment, which rebounded somewhat in 2021-22 but has not returned to pre-pandemic levels. Meanwhile, the rapid rise in homeschooling seen during the first year of the pandemic has not persisted – approximately 63% of the growth in the homeschool enrollment seen in the 2020-21 school year was lost during the 2021-22 school year. Sources: DPI Statistical Profile; North Caroline Private School Statistics; North Carolina Home School Statistical Summary ATTENDANCE Attendance became more difficult to track during the pandemic because of the variety of instructional delivery methods used, intermittent school closures, and quarantine requirements. As a result, the percentage of students reported as chronically absent in public schools fluctuated relative to pre-pandemic levels (see Figure 2 below). Source: North Carolina School Report Cards State Highlights Report In addition to being substantially higher than pre-pandemic years, documented chronic absenteeism in 2020-21 varied significantly across student subgroups. Source: North Carolina School Report Cards State Highlights Report Attendance policies for remote and hybrid learning during the 2020-21 school year were set by local school districts and varied greatly across the state. Variability in (or lack of) district attendance policies for remote instruction had some effect on documented chronic absenteeism amongst traditional public school students. Source: EdNC and Public Impact Relatedly, districts provided varying amounts of in-person and remote instruction during the 2020-21 school year. Students of color were more likely to receive remote instruction than White students. However, certain at-risk student populations – such as homeless students, students in foster care, and students with disabilities – were as likely as the average student to receive remote instruction. Source: DPI Operational Status Dashboard AND THERE’S MORE For more information on student enrollment and attendance, here are a few more resources: DPI Statistical Profile – includes North Carolina traditional public and charter enrollment information. North Carolina Homeschool and Private School enrollment information. North Carolina School Report Card State Highlights Report – highlights notable patterns for students, educators, and schools in North Carolina. EdNC and Public Impact reporting on Fall 2020 School Reopening Plans. DPI Operational Status Dashboard – DPI tool used to track live, remote, and hybrid instruction during the 2020-21 school year.
2022 Spotlight On Series: Students with Disabilities in North Carolina The Individuals with Disabilities Education Act (IDEA) guarantees students with disabilities a free and appropriate public education, guided by an individualized education program developed by educators in partnership with the student’s parent/guardian. Federal funding for students with disabilities exceeds $350 million annually. The state of North Carolina allocates $4,550 per special education student, for an additional $965 million. Under North Carolina’s existing policy, funding can be allocated for up to 13% of a school district’s or charter school’s average daily membership. In 2020-21, the percentage of students receiving special education services ranged from 7.6% in Clinton City Schools to 19.8% in Haywood County Schools and Watauga County Schools (see Figure 1 below). In some cases, state and federal funding do not cover the full cost of providing special education services for each child. This occurs most often with students who have severe disabilities, as their necessary special education services are more expensive to provide. In order to remedy this problem, a 2010 report prepared for the North Carolina General Assembly recommended that state allotments for students with disabilities be organized into three tiers based on the severity of the child’s disability, but the changes have not been enacted. Students are most often identified as requiring special education services between the ages of 6 and 9 (between first and fourth grade). The population of students receiving special education services peaks during the middle school, before falling slightly in the early years of high school, and more significantly as students approach the end of their high school careers. One requirement of IDEA is that students receiving special education services be educated in the least restrictive environment for that student, meaning, to the greatest extent possible, students are educated in regular classrooms with peers who do not receive special education services. During the 2020-21 school year, 69% of North Carolina students receiving special education services spent 80% or more of their day in a regular classroom, while less than 2% required an placement outside of a traditional school setting. The percentage of North Carolina students in K-12 traditional public schools receiving special education services has remained consistent at around 14% from 2005 to 2020 (nationally, 15% of students receive special education services); however, the percentage of students within each disability category has shifted significantly. Sources: DPI Statistical Profile Tables 1 and 9 NC DPI Federal Child Count Reporting National Center for Education Statistics Annual Reports: “Students with Disabilities”
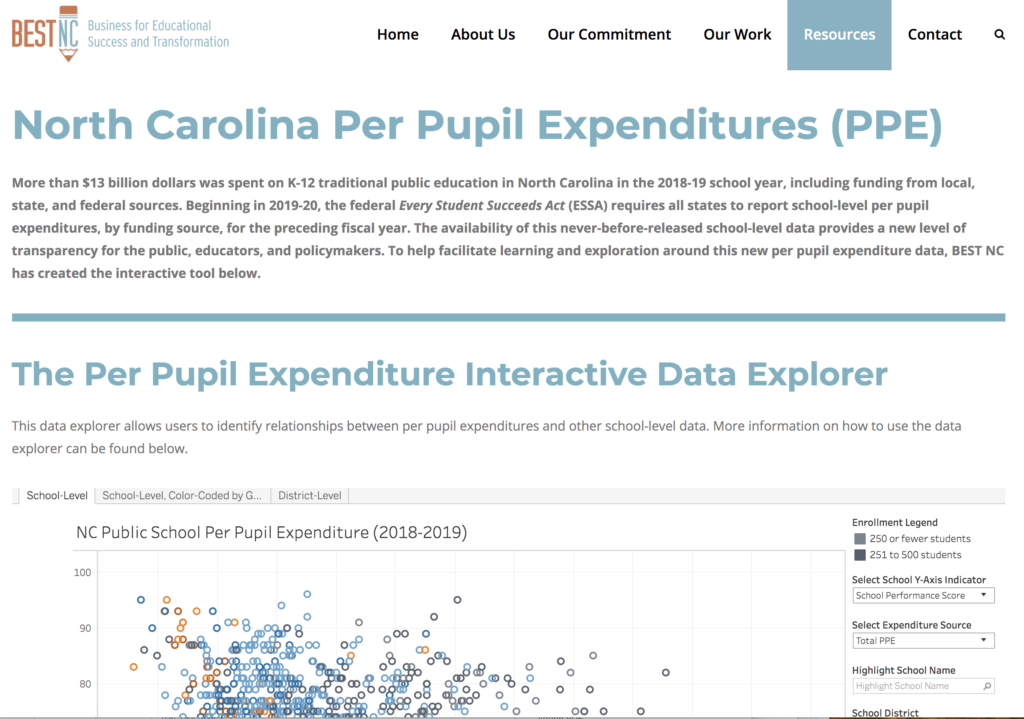
BEST NC Launches North Carolina School-Level Per Pupil Expenditure (PPE) Data Summaries and Interactive Tool BEST NC is pleased to announce the launch of a new Per Pupil Expenditure (PPE) interactive tool and landing page designed to facilitate the understanding and exploration of North Carolina’s recently released school-level per pupil expenditure data and its relationship to other school and district-level data. The federal Every Student Succeeds Act of 2015 requires each state education agency to release school-level per pupil expenditure data beginning with the 2018-19 academic year. This is the first time per pupil expenditure data have been made available at the school level in North Carolina. This web-based per pupil expenditure interactive data tool allows education stakeholders to explore per pupil funding trends across individual schools, within districts, and across districts in North Carolina. For the first time, educators, school leaders, parents, policymakers, advocates, and other members of the public can look at spending and performance for similar schools based on size, grade span, geographic locale, percent students with disabilities, and poverty. By comparing like schools, individuals can identify potential best practices around the state and pinpoint opportunities for targeted intervention. For example, a school leader could look at similar schools across the state to find inspiring results that might help them curate best practices for their own school. Similarly, a district leader may look for spending trends in their district as compared with other districts. The School-Level Per Pupil Expenditure (PPE) tool as well as summary analyses and additional resources can be accessed on the PPE landing page. New Data, New Insights: Key Findings About North Carolina’s Public Schools For the first time ever, North Carolinians can explore per pupil expenditures by school type, instead of being limited to district-level metrics. These data have allowed for new insights, which are highlighted on BEST NC’s School-Level Per Pupil Expenditure landing page, within the interactive PPE tool, and in our 2020 Facts & Figures guide. Some examples of these findings include: Generally speaking, total per pupil expenditures in North Carolina are higher in lower-income schools (see scatterplot). A deeper analysis in the 2020 Education Facts & Figures guide finds that about $2,800 more is spent per pupil in the highest poverty schools than in the lowest poverty schools. In a school with 500 students, this equates to around $1.5 million in additional resources. In this way, North Carolina defies national trends in which lower income schools generally receive less funding than more affluent schools. In general, expenditures of local funds, even within an individual district, appear to be uncorrelated or negatively correlated with poverty, so funding equity in most districts is a function of state and federal funding allocations. Student academic growth does not seem to be correlated with spending, with schools that exceeded growth spending about the same per pupil as schools that did not meet expected growth. Schools in the middle – those that met growth – spent about $300 more per pupil than other schools. Per pupil expenditures by race/ethnicity indicate about $700 more in per pupil spending for Black students than white students, validating the 2019 finding by EdBuild that North Carolina is one of just 14 states in which predominately nonwhite districts receive more funding than predominately white districts. Per Pupil Expenditures in the highly successful Cooperative Innovative High Schools are lower than in other high schools by about $700 per student. As with any large data set, we encourage caution in making causal assumptions. This tool is intended to be a starting point for robust conversations about best practices, wise investments, and – most importantly – how to ensure student success. In the months ahead, the impacts of the COVID-19 pandemic will be far-reaching for K-12 public schools, including the potential loss of funding due to decreased revenue. As state and district leaders consider adjustments to school spending, we encourage them to examine these data and look for inspiration and best practices from schools in our state that are succeeding with fewer resources and/or with higher populations of disadvantaged students. BEST NC, in partnership with the Collaborative for Student Success and HCM Strategists, will host a series of webinars designed to help key audiences learn how to use this interactive tool. If you are interested in attending one of these sessions, please email info@BESTNC.org. Also, additional data will be incorporated, and updates will be made to the tool over the next few weeks. If you have suggestions on how to improve this tool, please email using the address above. About BEST NC BEST NC (Business for Education Success and Transformation in North Carolina) is a nonprofit, non-partisan coalition of more than 100 business leaders who are committed to improving North Carolina’s education system through policy and advocacy. Our vision is that every student in North Carolina will graduate with the knowledge, skills, and behaviors to succeed in a competitive global economy. Our mission is to unite an engaged and informed business perspective to dramatically transform and improve education in North Carolina.
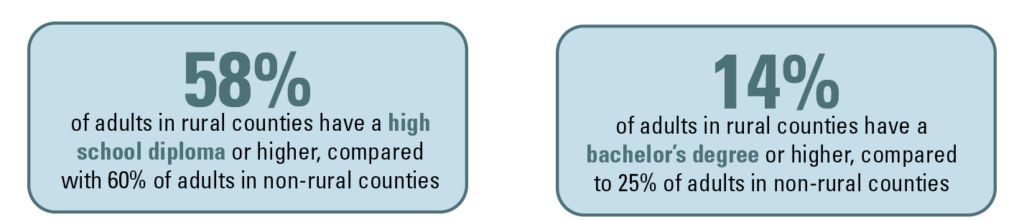
Spotlight On: Rural Students in North Carolina (Updated for 2021) North Carolina has the second largest rural student population in the United States (after Texas), with 524,955 rural students in 2018-19, 36% of all K-12 students. Eighty of North Carolina’s 100 counties are rural, defined as a county with an average population density of 250 people per square mile or less.
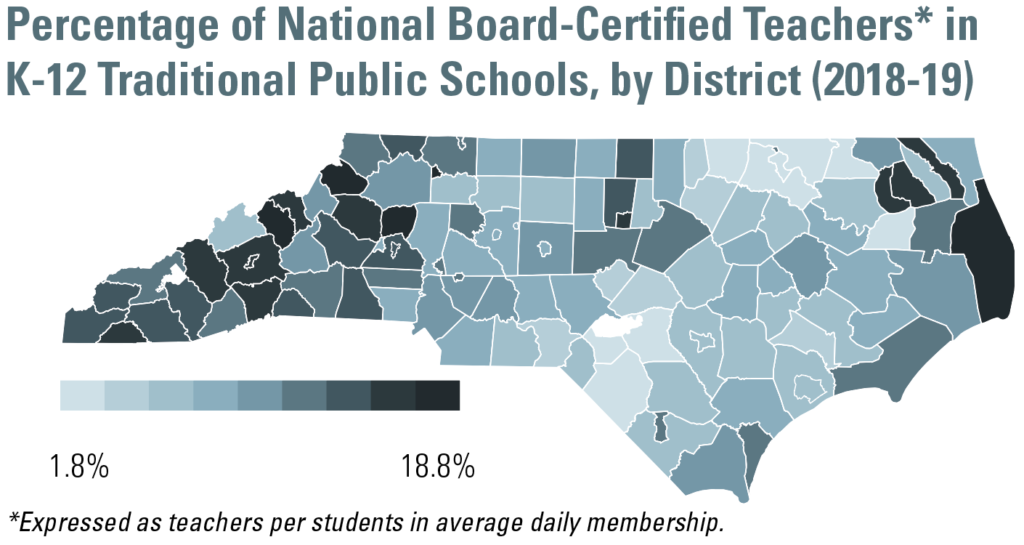
Spotlight On: National Board-Certified Teachers (Updated for 2021) The National Board Certification process, offered by the National Board for Professional Teaching Standards, recognizes high-quality teaching. The certification process uses rigorous standards to evaluate teaching practice through performance-based assessments. Correlational studies have consistently found that students taught by Board-certified teachers learn more than students taught by other teachers. At 23,090, North Carolina ranks #1 in the nation with the most National Board-Certified Teachers. Approximately 10% of all teachers in North Carolina Traditional Public Schools districts are Board-certified, but employment is lower in high-poverty schools. North Carolina is one of 25 states that provide additional compensation for teachers that are Board-certified, including seven in the Southeast.
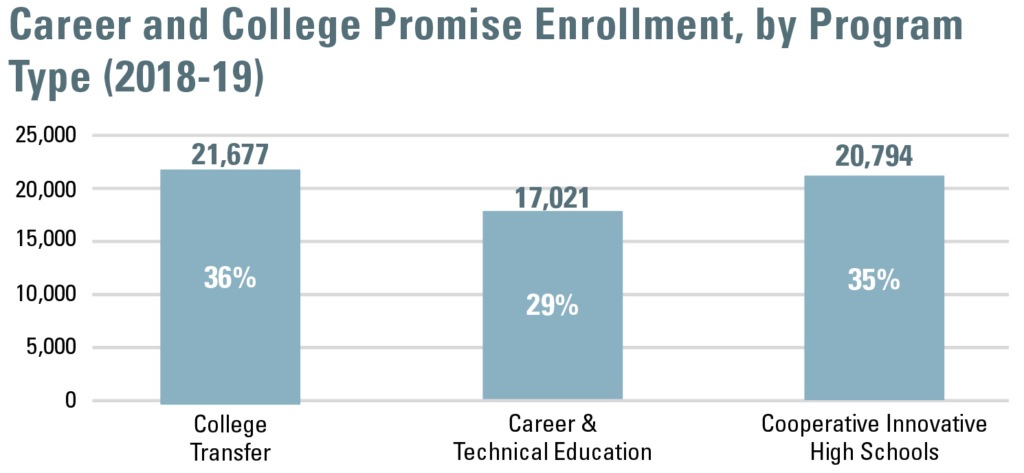
Spotlight On: Career and College Promise (Updated for 2021) In 2019-20, 70,801 public high school students participated in the Career and College Promise (CCP) program, which offers qualified high school students the opportunity to enroll in community college and university courses that provide pathways to a certificate, diploma, degree, or state- or industry-recognized credential. Enrollment in these courses is free for students and many courses county for both high school and college credit. CCP Pathways: College Transfer – Requires completion of at least 30 semester hours of college transfer courses, including English and mathematics. Career and Technical Education – Requires completion of courses leading to a certificate or diploma aligned with a high school career cluster or leading to a state- or industry-recognized credential aligned with a high school career cluster. Cooperative Innovative High Schools (CIHS) – Often located on college campuses, CIHSs provide opportunities for students to complete an associate degree program or earn up to two years of college credit within five years, e.g. Early College High Schools. In 2020, North Carolina was one of just 10 states that have enacted specific legislation to create and/or sustain early college high schools, the most common type of Cooperative Innovative High Schools (CIHS) across the state. CIHSs have significantly higher college acceptance rates than traditional, charter or private students.
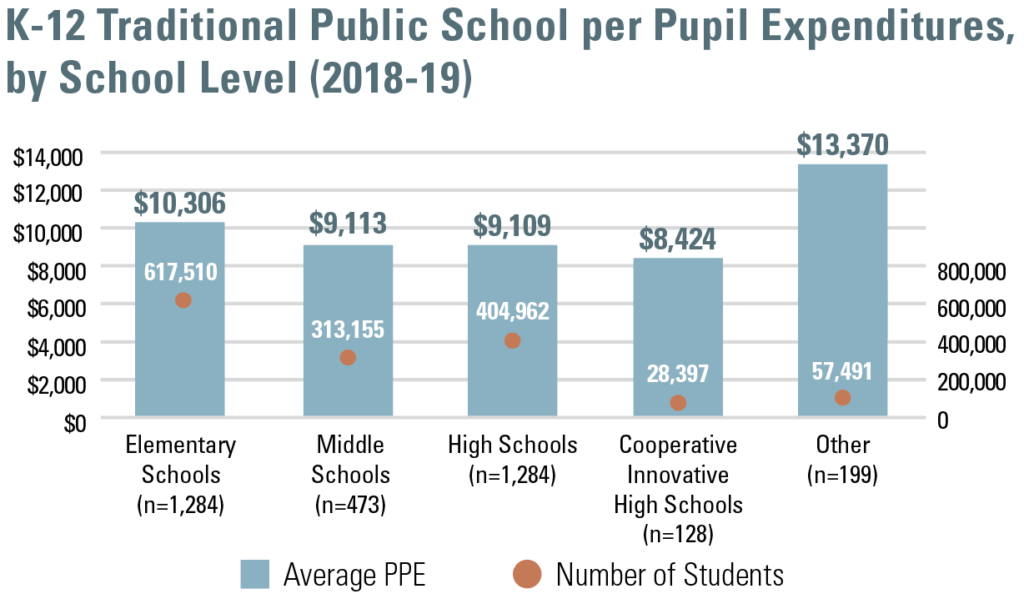
Spotlight On: per Pupil Expenditures (PPE) (Updated for 2021) More than $13 billion dollars was spent on K-12 traditional public education in North Carolina in the 2018-19 school year, including funding from local, state, and federal sources. Beginning in 2019-20, the federal Every Student Succeeds Act (ESSA) requires all states to report school-level per-pupil expenditures, by funding source, for the preceding fiscal year. The availability of school-level data allows a new level of transparency for the public, educators, and policymakers. This spotlight features analysis that is now possible with these new data. Additional data/tools can be found at www.BESTNC.org/PPE201819 as well as on the North Carolina School Report Cards. Average per pupil expenditures for high-poverty schools are about $3,000 more per pupil than low-poverty schools.

Spotlight On: myFutureNC (Updated for 2021) Throughout the 2020 edition of Facts & Figures, the myFutureNC icon indicates key education performance measures directly tied to North Carolina’s education-to-workforce continuum and the state goal of increasing educational attainment to 2 million by 2030. For more information visit: myfuturenc.org. In 2017, North Carolina was just one of nine states that had not yet set a goal for educational attainment. The myFutureNC Commission was formed to develop a vision for attainment across North Carolina, from early childhood through postsecondary education. In 2019, the myFutureNC Commission announced a new statewide goal to help build a cross-sector, coordinated approach that tackles systemic challenges and barriers across the education continuum: On the current trajectory, myFutureNC estimates that North Carolina will fall short of individuals with the skills needed to fill our state’s projected 2030 jobs needs by at least 400,000 people. Increasing educational attainment will help North Carolina attract and retain businesses, while improving the livelihood of individuals and families across the state. Higher education is associated with higher earnings:
Announcing TeachNC: The One-Stop Resource for Becoming a Teacher in North Carolina We are thrilled to share that, for the first time ever, North Carolina has a unified, statewide teacher recruitment initiative that elevates the teaching profession and seeks to fill critical vacancies! At the August 14th meeting of the North Carolina Education Cabinet, education leaders and stakeholders gathered to celebrate the launch of TeachNC. Aligning with BEST NC’s longstanding commitment to improving the educator pipeline, we have collaborated with the North Carolina Department of Public Instruction and TEACH.org to create this statewide teacher recruitment initiative. TeachNC employs both a broad media campaign and a robust web platform to support teacher candidates in their quest to become a teacher in North Carolina. Members of the NC Education Cabinet stand in support of TeachNC. Why TeachNC? Every student deserves a quality education — that’s a given. What you might not know is that teacher quality is the #1 in-school factor for guaranteeing students’ long-term success. Since educators play a crucial role in the lives of our students, TeachNC is designed to inspire teaching candidates to pursue the career and remove barriers that stand in their way. The Audience The TeachNC initiative seeks to provide accurate and compelling information about the teaching profession that will be useful to both potential candidates and the general public. TeachNC targets students who are just beginning to think about their career options all the way to mid-career professionals who may be considering a career change. The Campaign TeachNC’s media campaign, “Teachers Have Better Work Stories,” highlights the ways in which teaching profession is challenging, fulfilling, and constantly evolving. These career qualities are particularly appealing to Millennials and Generation Z as they seek fulfilling professions. TeachNC’s first public service announcement can be viewed below. TeachNC will also be curating Better Work Stories from real North Carolina teachers. To view the stories collected so far, click here. If you are a teacher or know of one who should share their Better Work Story, please share it here. The Website TeachNC.org is an interactive digital recruitment platform that centralizes all of the information and resources needed to become a teacher: Licensure Understanding licensure is the first step to becoming a teacher. TeachNC outlines licensure requirements and pathways for all candidates, from beginning college students to mid-career professionals. Programs To help candidates choose an educator preparation program (EPP) that will qualify them for licensure, TeachNC provides a database of North Carolina’s EPPs, criteria to help candidates compare options, and advisors to provide 1-on-1 support. Affordability To help candidates understand affordability, TeachNC provides a finance guide with best practices, local and national scholarship listings, and cost-saving strategies. TeachNC also offsets candidates application costs through a $100 reimbursement scholarship. Applications Understanding licensure is the first step to becoming a teacher. TeachNC outlines licensure requirements and pathways for all candidates, from beginning college students to mid-career professionals. More to Come, and What YOU Can Do: Over the next months and years, TeachNC will continue to expand its resources with district landing pages and updated information as licensure requirements change. In the meantime, here is what you can do to help: If you know someone who is thinking about becoming a teacher, please share www.TeachNC.org and encourage them to register to get (free) resources. If you are a teacher and want to share your Better Work Story, take just a minute to film with your phone and upload it here. If you have any ideas or questions, reach out to the TeachNC Director, Princess Brown at Princess@TeachNC.org. TeachNC Partners TeachNC Funders
2019 Legislative Gathering

A core principle guiding BEST NC’s work is the idea that well-informed conversations can lead to real, meaningful change in the lives of North Carolina’s students and educators. It’s why we produce Facts & Figures, the most comprehensive guide to education data in the state. It’s why we convene the Education Innovation Lab every year, providing a platform for the thinkers, educators, and policymakers at the forefront of education transformation in North Carolina. And it is exactly why we invited BEST NC members, policymakers, and the NC FIT Leaders to come together at the Raleigh Convention Center for an evening of conversation and learning at our 6th annual Legislative Gathering. In case you missed it, here is a quick recap of the event. First in Flight. First in Freedom. Why shouldn’t North Carolina be First in Teaching, too? This was the question that led over 70 educators from across North Carolina to come together in 2018 to share their stories, experiences, and ideas with the goal of elevating their profession. As you may know by now, this group of dedicated individuals is known as the FIT Leaders. You can learn more about them here. This year’s Legislative Gathering presented an opportunity for conversations between business leaders, policymakers, and FIT Leaders, culminating in the release of the NC First in Teaching Roadmap, which highlights practical and actionable innovations to improve the teaching profession and allow educators to better serve their students. You can download a copy of the FIT Roadmap here. Following greetings from BEST NC Board Member Chuck Purvis, Superintendent Mark Johnson, and Governor Cooper’s Education Policy Advisor Geoff Coltrane, NC Teacher of the Year Freebird McKinney spoke on FIT Leadership and how the educational landscape is already beginning to see the positive effects of this transformational movement. You can find Freebird’s inspiring speech entitled “The Powerful Force of ‘Bridge Builders’ Across North Carolina” and a short video highlighting several FIT Leaders here. Conversations with Policymakers: Representative John Fraley joined FIT Leader and Iredell-Statesville Schools Assistant Superintendent for Human Resources Dr. Alvera Lesane to discuss how strong school leadership influences teacher recruitment and retention. In North Carolina, a lack of strong school leadership and direction is the main reason teachers leave their jobs. Therefore, Strong School Leadership is a key strategy to making North Carolina First in Teaching and is described in the NC FIT Leaders Roadmap. Next, Senator Dan Blue spoke about teacher recruitment with Kimberly Mawhiney, FIT Leader and Science Teacher in Currituck County Schools. Strengthening Teacher Recruitment is another critical strategy detailed in the NC FIT Leaders Roadmap. “My main takeaway from the evening is this: Legislators want to hear from teachers. Senator Blue stated: ‘I am not an expert’. This was a powerful statement that I have also heard from Craig Horn. We, as teachers, are the experts. That means, we need to do what we do best: TEACH! Legislators can only do what they think is best. If we do not raise our voices and let them know what we need, how do they know what is best? I implore all educators to reach out to those that shape our education policy and do what you do best…teach!” Kimberly Mawhiney As an organization – as North Carolinians – we are proud to say that these are the conversations that inspire BEST NC and lay the groundwork for an energized, nation-leading education system powered by passionate, highly-skilled education professionals. Click here to see more photos from the 2019 Legislative Gathering.