Best Practices in Teacher Pay: Strategic Staffing Models

Best Practices in Teacher Pay: Strategic Staffing and Advanced Teaching Roles A comprehensive, professional compensation plan includes layered pay strategies that build on one another to ensure the recruitment and retention of a high-quality workforce. This is the fifth in a series of blogs highlighting best practices in teacher pay featured in detail in BEST NC’s report, Teacher Pay in North Carolina: A Smart Investment in Student Achievement. Strategic Staffing Models Offer High-Skill Professionals Mastery, Autonomy, and Purpose In his book Drive: The Surprising Truth About What Motivates Us, Daniel H. Pink examines professional compensation and how it does (and does not) motivate employees. He contends that base pay is fundamentally important to fulfill a biological need to support oneself and one’s family. It also matters that individuals feel that they are fairly paid for the skills they hold and the work they do. Once these baseline pay needs are met (i.e., they are adequate and equitable), what drives high-skill professionals to improve their performance are intrinsic motivators like better working conditions, more career opportunities, and the satisfaction of working with a great leader – specifically, jobs that offer mastery, autonomy, and purpose. While compensation is, by definition, an extrinsic motivator, it can also fund and fuel organizational structures that provide intrinsic motivators to both the recipient and their colleagues. For example, most schools operate outdated, flat organizational models that provide teachers with minimal opportunities for professional advancement without leaving the classroom. In these scenarios, all teachers are stuck on the same pay schedule, regardless of whether they have the skills and willingness to extend their reach beyond a traditional teaching position. Data from the National Center for Education Statistics School Staffing Survey indicate that almost one in ten teachers leaving the profession cite a lack of opportunities for professional advancement among the reasons for their departure. Instead, compensation systems should facilitate the development of innovative organizational structures that provide intrinsic motivators such as the opportunity for advancement or greater professional support, as opposed to the “one teacher, one classroom” system that exists now. These modernized organizational structures, known in North Carolina as Advanced Teaching Roles, allow effective teachers to extend their reach to additional students and/or teams of teachers and earn more money while doing so. These strategic staffing models help increase the instructional skill and capacity of the entire staff while also enhancing the level of purpose experienced by lead teachers. Advanced Teaching Roles: North Carolina’s Strategic Staffing Initiative In North Carolina, 24 school districts are offering career advancement opportunities to teachers through the state’s Advanced Teaching Roles program. In schools using ATR, highly effective teachers are elevated to leadership positions in which they receive substantial, ongoing pay increases for taking on additional responsibilities and extending their reach. These teachers, in turn, provide intrinsic motivators to their colleagues by elevating their mastery and impact in the classroom. In ATR models, teachers extend their reach by either directly teaching more students or – more often – by leading a team of teachers and providing instructional support for all the teachers on the team. As a result, ATR teachers increase the instructional capacity of the entire staff; provide embedded, intentional support for novice teachers; and ensure more students get access to effective instruction. Additionally, since leadership is distributed in a more balanced and purposeful way, principals are more accessible and can focus on other critical school operations like staffing, curriculum, family and community relations, and more. Salary supplements for ATR positions range from $2,000 to $10,000 for Extended Reach Teachers, who directly teach a greater number of students, and from $6,000 to $20,000 for Lead Teachers, who lead groups of teachers and are responsible for the learning of all the students on their team. A study of ATR programs in Charlotte-Mecklenburg Schools, Cabarrus County Schools, and Syracuse City School District (New York) found that teachers on a Multi-Classroom Leader (MCL) team benefitted immensely from that support. Teachers joined the MCL-led teams, on average, at the 50th percentile in student learning gains. After one year on an MCL team, they produced learning gains equivalent to teachers in the 75th to 85th percentiles in math, and the 66th to 72nd percentiles in reading. In 2021-22, Title I schools in North Carolina implementing ATR staffing models had higher student growth scores, on average, than Title 1 schools not using ATR (see Exhibit 1, to the right). Expansion of the Advanced Teaching Roles program is a high-impact strategy to increase pay, while extending the reach and purpose of highly effective educators and improving the instructional capacity and mastery of all teachers. Expanding Advanced Teaching Roles in North Carolina would modernize severely outdated school staffing models while providing benefits to students, teachers, and school leaders alike.
Best Practices in Teacher Pay: Front-Loading Base Pay, a Key Strategy for Teacher Compensation
Best Practices in Teacher Pay: Front-Loading Base Pay, a Key Strategy for Teacher Compensation A comprehensive, professional compensation plan includes layered pay strategies that build on one another to ensure the recruitment and retention of a high-quality workforce. This is the fourth in a series of blogs highlighting best practices in teacher pay featured in detail in BEST NC’s report, Teacher Pay in North Carolina: A Smart Investment in Student Achievement. In the first three parts of our teacher pay blog series, we examined three key reasons to include front-loaded base pay in any strategic teacher compensation model. To recap: Front-Leading Base Pay for Professional Growth: A front-loaded base pay aligns salary increases to the times in a teacher’s career when they are making the greatest gains in effectiveness, and can act to limit teacher attrition, which is highest during the early part of teachers’ careers. Front-Leading Base Pay to Provide a Living Wage: A front-loaded pay schedule would help address biological pay motivators – the need to reasonably support oneself and one’s family through a living wage, particularly at the point where one is likely to be growing their family. Front-Leading Base Pay, A Common Practice for High-Skilled Professionals: A front-loaded pay schedule better aligns with other high-skilled professions and is needed to recruit top-tier talent into the teaching profession. Front-Loading Base Pay to Mirror Other High-Skilled Professions While discussions of teacher pay often focus on starting salary and maximum salary, the distribution of raises – their size and the years in which they occur – has an outsized impact on teachers’ ability to meet the financial challenges that come with starting and growing a family. In Exhibit 1 below, we examine the cumulative earnings of two teachers working under different salary schedules. Each schedule incorporates a 10% increase in state spending on teacher pay, but structures the raises differently. In the first example, we apply a 10% across the board increase to the existing state salary schedule in which teachers reach their maximum base salary at year 25. In the second example, we utilize a 10% increase in state spending to front-load the salary schedule so that teachers reach their maximum base pay at year 10. Over a 30-year career, the lifetime earnings of these teachers are equivalent. However, owing to significant raises in the front half of the schedule, the teacher in the front-loaded compensation model earns 8% more in their first 10 years than the same teacher working under the traditional salary schedule. Higher earnings in the first ten years of a teacher’s career, when they are establishing their families, allow them to keep up with the rapid increases in expenses that come along with having children, purchasing a home, and other costs associated with starting a family. Note: Other components of salary, including bonuses, National Board-Certified Teacher supplements, and local salary supplements are not considered in this analysis. . Exhibit 2 below shows the average base pay and cumulative pay increases, at five-year intervals, for teachers receiving across-the-board and front-loaded pay increases. Note: Other components of salary, including bonuses, National Board-Certified Teacher supplements, and local salary supplements are not considered in this analysis. The exhibits below illustrate how a 10% increase in state spending on teacher pay can work to shrink the living wage gap for teachers. First, Exhibit 3.1 shows the existing state salary schedule for teachers and the typical living wage trajectory. The green shaded area illustrates that, when looking only at state base pay, an estimated 64,000 teachers currently fall in the living wage gap. When a 10% increase is applied evenly across the current salary schedule, an estimated 18,500 teachers still earn less than the living wage when accounting for only their state base pay. By comparison, making the same 10% investment in a front-loaded salary schedule would leave around 6,000 teachers with state base pay that is below a living wage. Note: Does not include local supplements. This illustration clearly shows that teacher pay increases that front-load the state salary schedule reduce the living wage gap by greater magnitudes, helping early career teachers better meet financial challenges that come with starting a family. The estimated number of teachers whose base pay and total pay (including local supplements) is below a living wage for the current schedule and in each of the two 10% investment scenarios can be found in Exhibit 4.
Best Practices in Teacher Pay: Front-Loading Base Pay, a Common Practice for High-Skilled Professionals
Best Practices in Teacher Pay: Front-Loading Base Pay, a Common Practice for High-Skilled Professionals A comprehensive, professional compensation plan includes layered pay strategies that build on one another to ensure the recruitment and retention of a high-quality workforce. This is the third in a series of blogs highlighting best practices in teacher pay featured in detail in BEST NC’s report, Teacher Pay in North Carolina: A Smart Investment in Student Achievement. Front-Loading Base Pay to Mirror Other High-Skilled Professions In part 1 and part 2 of this teacher pay blog series, we examined how a front-loaded salary schedule aligns with increases professional growth and addresses the biological need to earn a living wage. Front-loading base pay is also a common practice for high-skills professionals in other industries. They are generally rewarded with substantial pay increases earlier in their career, commensurate with the rapid acquisition of skills (see Exhibit 1 to the right). Then, as skill acquisition slows and performance levels out, additional compensation is added based on increased workload or unique, high-demand skills. In education, however, traditional teacher salary schedules require decades of employment to reach an adequate level of base pay. And unlike other professions, such as nursing, there are few opportunities for career growth and added compensation while remaining a teacher. Another way to visualize this dynamic is to examine the age at which pay peaks. While those working in other high-skilled professions reach their highest pay level by age 40 (or within 10-15 years of experience), teachers enter their 40s with much lower earnings on average than they will make if they stay in the profession for another decade. Teachers also do not hit their peak earnings until around age 55 (or between 25-30 years of experience, about twice as long). The chart below utilizes national data to illustrate this challenge. Importantly, this slow increase in pay for teachers also means that lifetime earnings are reduced, when compared to a front-loaded pay structure. Top-Tier Candidates Expect a Front-loaded Pay Schedule Not only is front-loaded pay common practice in many professions, it is also the expectation of top-tier students when they are considering their career options. A survey of college graduates in the top third of their class underscores the role that overall earnings potential plays in deterring top graduates from becoming teachers (see Exhibit 3 below). Front-Loaded Base Pay for Other Public Sector Professionals North Carolina’s gradually increasing teacher salary schedule is also misaligned with the front-loaded pay structures of other public sector state employees. Even with a substantial investment in teacher pay between 2014-15 and 2018-19 that halved the time it took for North Carolina teachers to earn $50,000 (from 30 years to 15 years), a recent analysis from the North Carolina General Assembly’s Fiscal Research Division shows that teachers progress more slowly up the salary schedule than other state employees (see Exhibit 4 below). For example, law enforcement officers and prison system employees reach maximum base pay at six years of experience, while teachers do not reach their maximum base salary until 25 years into their careers. Note: While these data illustrate the need for a steeper salary schedule, in which teachers reach their earning potential much faster, this chart also shows that teacher pay is below that of other state employees, signaling an overall need to increase the competitiveness of teacher pay. UPCOMING: The next blog in our teacher pay series will dive into the data to illustrate how a front-loaded pay schedule helps early-career teachers support their families.
Best Practices in Teacher Pay: Front-Loading Base Pay to Provide a Living Wage
Best Practices in Teacher Pay: Front-Loading Base Pay to Provide a Living Wage A comprehensive, professional compensation plan includes layered pay strategies that build on one another to ensure the recruitment and retention of a high-quality workforce. This is the second in a series of blogs highlighting best practices in teacher pay featured in detail in BEST NC’s report, Teacher Pay in North Carolina: A Smart Investment in Student Achievement. Front-Loading Base Pay to Provide a Living Wage The first blog in our examination of Front-Loaded Base Pay explored how a front-loaded pay schedule better aligns with early-career surges in professional growth. In this blog, we discuss how a front-loaded pay schedule helps address biological pay motivators – the need to reasonably support oneself and one’s family. While compensation levels are generally a function of market forces, it is reasonable that the minimum bar for high-skilled public employees should be at or above the living wage. With a substantial portion of North Carolina teachers currently paid below a living wage (approximately 20% of teachers, when including local supplements), this is an important call to action to front-load and modernize the state’s teacher salary schedule. What is North Carolina’s Living Wage? The Massachusetts Institute of Technology’s (MIT) Living Wage Calculator provides living wage data for North Carolina as a whole, as well as each county. A large affluent district like Wake County requires a higher living wage, for example, than rural counties like Halifax in the east or Caldwell to the west (see Exhibit 1 to the right). The living wage is calculated for a wide range of household circumstances, based on the number of adults, children, and working adults. For simplicity, we examine two scenarios: a single adult with no children and a two-parent household with two children, each with incomes about the same. j How the Step-and-Lane Schedule Stifles the Ability to Reach a Living Wage While average teacher pay in North Carolina is at or above a living wage level, the structure of our pay schedule creates a significant gap between salaries and a living wage early in a teacher’s career, when they are reaching their full professional capacity, but still far from the peak of their earning potential. The charts below show the 2022-23 state teacher salary schedule overlaid with the living wage trajectory for a typical professional educator, with and without local salary supplements. In each chart, we have included the living wage trajectory for two different types of teachers – traditionally prepared, who start at age 25, on average, and all other teachers, who have a median starting age around 30 years old. In these charts, the gap between the current salary schedule and the living wage is shaded, clearly illustrating the inadequate income levels at the front of the salary schedule. Exhibit 2 shows the state teacher salary schedule, or base pay schedule, without local supplements. When looking only at state pay, we estimate that, in any given year, nearly 65% of teachers earn less than a living wage. j j When you include estimated local salary supplements (see Exhibit 3 below), an estimated 20% of all teachers earn less than a living wage each year. j j How Front-Loading the Salary Schedule Can Reduce the Living Wage Gap The impact of front-loading the salary schedule on teachers’ ability to attain a living wage early in their careers comes into focus when considering a hypothetical investment to raise teacher pay in North Carolina by 20%. In one scenario, the 20% investment is made using a front-loaded salary schedule that aligns with most other professional industries, and in the other, the investment is spread out evenly across North Carolina’s step-and-lane salary schedule. Exhibit 4 below shows that, at the same level of investment, front-loading the teacher salary schedule allows a family with two working teachers and two children to reach a living wage more than twice as quickly than they would under the current step-and-lane salary schedule. j Note: This investment is projected to be made over a two-year period, so we have raised the living wage for a family of four (two incomes; two children) by 2% per year for the period of that two-year investment. UPCOMING: The next blog in our teacher pay series will explore how a front-loaded pay schedule aligns with other high-skilled professions and is needed to recruit top-tier talent into the teaching profession in North Carolina.
Best Practices in Teacher Pay: Front-Loading Base Pay for Professional Growth
Best Practices in Teacher Pay: Front-Loading Base Pay for Professional Growth A comprehensive, professional compensation plan includes layered pay strategies that build on one another to ensure the recruitment and retention of a high-quality workforce. This is the first in a series of blogs highlighting best practices in teacher pay featured in detail in BEST NC’s report, Teacher Pay in North Carolina: A Smart Investment in Student Achievement. Front-Loading Base Pay for Professional Growth We begin this blog series by examining a key component of any competitive compensation model, a base pay schedule that provides a living wage and builds with professional expertise. We refer to this foundational component as “Front-loaded Base Pay” and will utilize the next four blogs in our series to highlight the many benefits of a front-loaded pay schedule, beginning with Part 1: Front-Loading for Professional Growth. In contrast to pay practices in most professional industries, teacher compensation in North Carolina and across the country is driven by a 100-year-old step-and-lane salary schedule that bases pay solely on years of experience and educational attainment. As discussed in our recent blog, BEST NC Releases Comprehensive Teacher Pay Report – BEST NC, we find that this outdated pay and retention structure fails to recruit and retain the top-tier teaching candidates our students deserve. Exhibit 1, Below, demonstrates the difference between a traditional step-and-lane pay structure like North Carolina’s and a front-loaded pay schedule. Although lifetime income is the same if someone stays in the profession for 30 years, the front-loaded pay schedule allows teachers to reach their maximum base pay earlier in their careers. This aligns with the years in which most teachers demonstrate the greatest amount of professional growth, as well as living wage increases that we will examine in the next post. Note: This graph only represents base pay on top of which teachers should be eligible to receive additional supplements, bonuses, and raises later in their careers, including by taking on Advanced Teaching Roles and extending their reach to more students. Additionally, the entire schedule shifts up over time, typically to address inflation. A front-loaded base pay structure is used in many professional industries and is premised on the fact that pay rises along with employees’ sharp increase in professional skills early in their career. Like these other professions, research that suggests increases in teacher effectiveness are most significant during the first three years of a teacher’s career and level out after year five. This can be visualized by examining student growth data for North Carolina teachers at various points in their careers (see Exhibit 1 below). The most significant gains are seen between 0-2 and 3-5 years of experience and peak, on average, around the eighth year of teaching. A front-loaded teacher pay schedule aligns pay increases to the parts of a teacher’s career in which they are making the largest gains in their ability to positively impact student learning. Increasing early-career teacher pay also has implications for teacher retention. A study of teacher pay and retention in Texas from 1996 to 2012 found that increases in teacher base pay had greater positive impacts on teacher retention during the early parts of a teacher’s career (years 1 to 7) and no effect on the retention of teachers with 12 or more years of experience. Exhibit 3 below shows the number of teachers in North Carolina by years of experience and their attrition rates, affirming that, in the first 20 years of a teacher’ careers, the greatest attrition happens in the first six to eight years of teaching. Increasing and front-loading North Carolina’s teacher salary schedule works to combat these high attrition levels by providing a compensation incentive for more early-career teachers to continue in their careers. UPCOMING: The next blog in our teacher pay series will explore how a front-loaded teacher pay schedule better aligns with one’s need to earn a living wage to support a family.
BEST NC Releases Comprehensive Teacher Pay Report
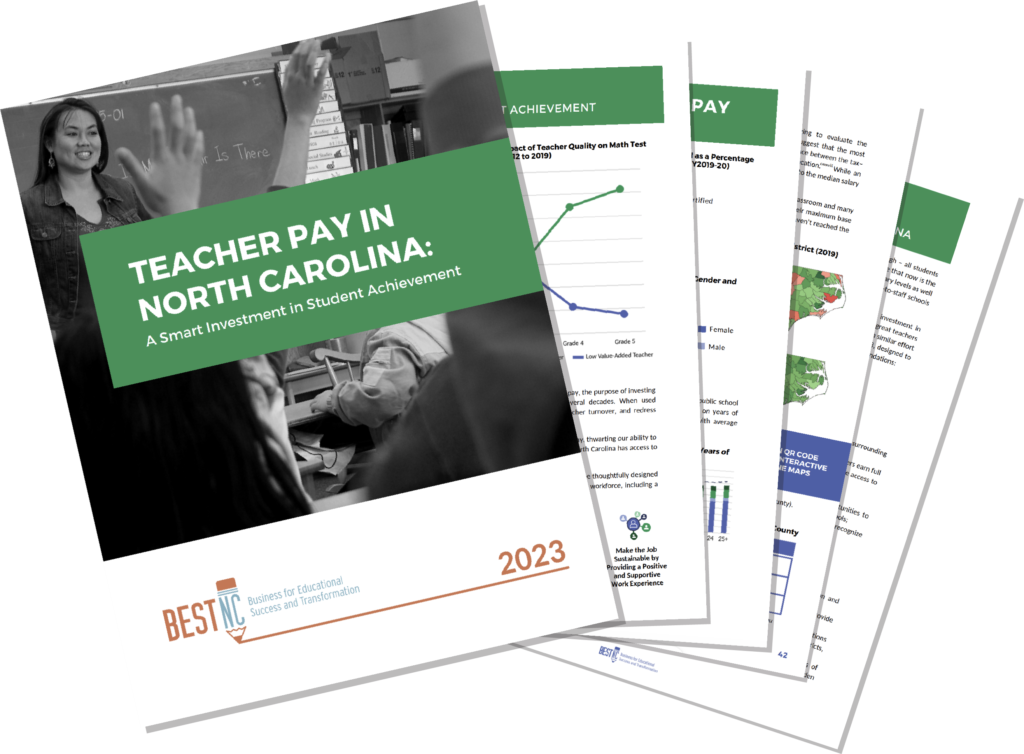
BEST NC Releases Comprehensive Teacher Pay Report In 2023, BEST NC released a new report on teacher pay entitled Teacher Pay in North Carolina: A Smart Investment in Student Achievement. The BEST NC team, along with leading economists and experts from across the country examined the complex issue of teacher pay. In our analysis, we uncovered important new evidence that the existing teacher pay structures in North Carolina, and across the country, fail to address dramatic decades-long shifts in our national workforce and are inadequate for meeting the personal and professional needs of today’s teachers. This teacher pay report offers specific, actionable recommendations for both an increased and transformed teacher salary structure that can help retain exceptional educators and attract the next generation of top-tier talent into North Carolina public schools. You can access the full report and the executive summary here. Below is an overview of the report. This is the first in a series of blogs that will highlight key concepts and recommendations from the report. Background: Why Professional Compensation Matters Research has consistently found that teacher quality is the most important in-school factor for student success, with high-performing teachers producing significantly higher achievement gains than low-performing teachers. Given this reality, it is essential for teacher compensation to attract highly qualified candidates into the profession and to support continued professional growth throughout their career in the classroom. In his NYT best-selling book Drive: The Surprising Truth About What Motivates Us, Daniel Pink contends that professional compensation is fundamentally important to fulfill an individual’s biological need to support oneself and one’s family (compensation must be adequate), and individuals must feel that they are fairly paid for the skills they hold and the work they do (compensation must be equitable). The Teacher Pay in North Carolina report considers Pink’s framing of professional compensation, compared to the current, 100-year-old teacher step-and-lane pay structure that is used in North Carolina and across the country. Through this lens, the report finds that our teacher pay and retention practices are outdated and fail to recruit and retain the top-tier candidates our students deserve. Beyond baseline requirements of adequacy and equitability, Pink finds that high-skilled professionals are motivated to perform at their best when their jobs present the opportunity for mastery, autonomy, and purpose. Current teacher pay practices and organizational structures, in stark contrast, encourage a “one-teacher, one classroom” approach that stifles growth and leaves high-performing teachers with few opportunities for professional advancement. Five Key Challenges of Current Teacher Compensation Models An exploration of research on best practices in teacher compensation revealed five major challenges, each of which is examined closely in the Teacher Pay in North Carolina report. Challenge 1: Teaching is a Mostly Female Workforce, Yet Teacher Pay Has Not Kept Up with Increasing Opportunities and Pay for Female, College-Educated Professionals. Nationally, between 1985 and 2021, median income for women with a bachelor’s degree grew by 22% when adjusted for inflation, compared to just 10% for teachers. Earnings for college-educated women have now eclipsed earnings for teachers. Women still comprise the majority of the teaching workforce, but, as women have more professional opportunities than ever before, teaching is arguably less attractive now than ever before for top-tier female candidates. v Challenge 2: Under the Existing Salary Schedule, North Carolina Teachers Must Wait Far Too Long Before Their Salaries Provide a Living Wage that Can Support a Family. Outside of retirement, teacher attrition is highest in the first five years of a teacher’s career. These years coincide with the time that teachers are starting to build their families. At this crucial juncture, the traditional step-and-lane schedule does not provide a living wage that allows teachers to support a family. The Teacher Pay in North Carolina report uses the Living Wage Calculator from the Massachusetts Institute of Technology, which leverages geographically specific data on living expenses (e.g. housing, health insurance, food, childcare), to estimate that nearly one-third of North Carolina teachers earned less than a living wage for a family of four in 2021-22. Even when compared to other public sector employees in our state, teachers earn less and take much longer to reach the top of the base salary schedule. Challenge 3: The Traditional Teacher Compensation Model Does Not Provide Meaningful Professional Promotions that Attract Top Talent and Keep Effective Educators in the Classroom. Research has demonstrated that the traditional step-and-lane salary schedule limits overall earning potential and discourages high-aptitude individuals from pursuing a teaching career. Reinforcing this notion, a report issued by McKinsey in 2010 revealed that 87% of top-tier candidates indicate that their preferred occupation provides opportunities to advance, compared to just 45% who believe teaching will provide similar advancement opportunities. The same report noted that nations that perform at the top on international assessments recruit 100% of teachers from students in the top-third of their class. In the United States it is 23%, and only 14% for teachers in higher poverty schools. Advanced Teaching Roles provide one pathway for highly effective educators to advance professionally as they take on greater responsibility and leadership. Currently, approximately 1,000 North Carolina teachers are working in advanced roles, earning up to $20,000 in additional pay. However, with just 21% of districts currently participating, there is significant room for growth. Challenge 4: Existing Pay Structures are not Designed to Fill Hard-to-Staff Subject Area Positions and Schools, Leading to Persistent, Critical Vacancies and Disparities in Student Access to Effective Educators. Like most states, teacher staffing inequities in North Carolina are driven, in part, by the structure of the state teacher salary schedule, which requires that teacher base pay is the same for equivalently experienced teachers, regardless of what, where, or how well a teacher teaches. In high-demand fields like STEM subjects, average teacher pay significantly trails average wages for recent UNC System graduates for those majors. These subject areas also see markedly higher teacher vacancy rates. Additionally, there are tremendous disparities in student access to highly qualified teachers […]

2023 Spotlight On Series: Return on Investment – Student Achievement and Education Expenditures
2022 Spotlight On Series: Federal COVID Relief Funding for North Carolina Schools Since March 2020, the United States government has provided nearly $337 billion in pandemic-related aid to be used to support the education of students across the country in preschool through higher education. North Carolina was allocated $9.4 billion in education funding through three separate federal laws. Note: The data in this post has been updated since the original release of this Spotlight On in Spring 2022. Ninety percent of ESSER funds, the largest packages for K-12 public schools, were delivered directly to public school units (PSUs) following the federal Title I funding formula, and PSUs have discretion over these funds, within limitations provided in federal law. Schools with higher percentages of economically disadvantaged students received more COVID relief funding, per student, than wealthier districts. COVID-19 funding ranged from $1,700 per pupil in Chapel-Hill Carrboro City Schools to $14,825 per pupil in Weldon City Schools. As of August 31, 2022, 48% of the $5.9 billion provided to PK-12 public schools for COVID-19 relief had been spent; and PSU’s have spent 97% of dollars allocated through funding streams that have expired or are expiring soon (see Figure 2). PSU spending trends have shifted as school and student needs have become clearer (see our Student Learning During the Pandemic blog post). For instance, money appropriated via Coronavirus Relief Fund in early 2020 was used primarily to help schools transition to remote education at the outset of the pandemic. Funding was heavily invested in supplies and materials, including personal protective equipment, computers for remote learning, and materials to support the delivery of school meals. Subsequent funding streams have been increasingly utilized to support students’ academic needs, including hiring additional teachers and staff, as well as providing funds for tutoring and summer programming. AND THERE’S MORE To learn more about COVID relief funding for North Carolina’s schools, and to view DPI’s visualizations of COVID fund allotments and expenditures, check out these links: NC DPI’s COVID Relief Funding Allotment and Expenditure Dashboard NC DPI’s COVID Relief Funding Website NC DPI’s Financial and Business Services COVID Funding Summary Presentation
BEST NC Launches Updated Per Pupil Expenditure Data Explorer Tool (2018-19 to 2020-21) BEST NC is pleased to announce the update of its Per Pupil Expenditure (PPE) Data Explorer and landing page, designed to facilitate the understanding and exploration of North Carolina’s school-level spending data and its relationship to other key education indicators. The updated tool features school-level and district-level expenditure data from the 2018-19, 2019-20, and 2020-21 school years. Charter school expenditure data has also been added. Additionally, the tool now offers the ability to examine longitudinal changes in spending at the school level and the ability to view COVID relief fund expenditures at the district level. About the Tool The federal Every Student Succeeds Act of 2015 requires each state education agency to release school-level per pupil expenditure data. The 2018-19 expenditure data were released in 2020, marking the first time spending data were made available at the school level in North Carolina and uncovering trends that have been masked by district-level data. BEST NC’s web-based Per Pupil Expenditure Data Explorer allows education stakeholders to explore per pupil funding trends across individual schools, within districts, and across districts in North Carolina. Educators, school leaders, parents, policymakers, advocates, and other members of the public can utilize this tool to examine education spending and student outcomes for similar schools based on size, grade level, geography, percent students with disabilities, poverty, and more. By comparing schools with similar characteristics, school leaders and other education stakeholders can identify schools with strong student performance at varying levels of funding and/or relative to the characteristics of their student body. Promising or innovative practices from these schools might then be examined to help improve teaching and learning in similar schools. Note: Student performance metrics are unavailable for the 2019-20 school year, as all end-of-year tests were canceled due to the COVID-19 pandemic. Additionally, in 2020-21, students took end-of-year tests, but North Carolina was granted a waiver from federal accountability requirements, meaning that student proficiency numbers are available, but other school-level metrics – such as School Performance Scores, School Achievement Scores, and School Growth Scores – are not. These data will be available for the 2021-22 school year. The Per Pupil Expenditure Interactive Data Explorer can be accessed on BEST NC’s PPE landing page, alongside summary analyses (see below) and additional resources. Insights and Trends from the Per Pupil Expenditure Data Explorer: Key Findings About North Carolina’s Public Schools With the release of school-level expenditure data, and with the help of BEST NC’s Per Pupil Expenditure Data Explorer, North Carolinians can now explore trends in school spending at the school level, instead of being limited to district-level metrics. Several school-level insights are highlighted on the PPE landing page. Examples of these findings include: Generally, total per pupil expenditures in North Carolina are higher in schools with greater numbers of economically disadvantaged students. In 2020-21, about $3,100 – 32% – more was spent per pupil in the highest poverty schools (schools where 76-100% of students are economically disadvantaged), compared to the lowest-poverty schools (schools where 0-25% of students are economically disadvantaged). In a school with 500 students, this equates to around $1.6 million in additional resources. In this way, North Carolina defies national trends in which lower income schools generally receive less funding than more affluent schools. In general, expenditures of local funds, even within an individual district, appear to be uncorrelated with poverty, so funding equity in most districts is a function of state and federal funding allocations. Total per pupil expenditures (including state, federal, and local funds) increased by $726 per pupil, or 7.5%, over the three-year period from 2018-19 to 2020-21.* $524 of this increase was due to an influx of federal COVID relief dollars. *The 2018 North Carolina state budget was passed in June 2018. Partially due to the COVID-19 pandemic, there was not another comprehensive state budget bill passed into law until November 2021, though some smaller appropriation bills were passed that funded education items. Since March 2020, North Carolina’s K-12 public schools have received over $6 billion in COVID relief funds from the federal government. Schools and districts spent $90 million in COVID relief funds during the 2019-20 school year, $660 million during the 2020-21 school year, and over $2 billion during the 2021-22 school year. Schools have until September 30, 2024 to spend the remaining COVID relief dollars. While COVID relief fund expenditures are not available at the school level (but are embedded in the state and federal fund amounts), district-level data reveal that more COVID relief were spent by districts with higher percentages of students identified as economically disadvantaged. This is likely because COVID relief funding was allocated according to the federal Title I funding formula which is designed to support schools with high concentrations of students in poverty. An in-depth analysis from the 2022 Facts & Figures guide found that districts in the highest poverty quartile received 79% more COVID relief funding, per pupil, than districts in the lowest poverty quartile, and the 10 highest-poverty districts received 163% more COVID relief funding, per pupil, than the 10 lowest-poverty districts. In 2020-21, average per pupil expenditures were $10,623 in traditional public schools and $8,765 in public charter schools. Charter schools, meanwhile, tended to serve students with lower levels of poverty: 54% of charter schools had less than one quarter of their student population living poverty, compared with 15% of traditional public schools. Rural schools in North Carolina (as identified by the U.S. Department of Education) spent about as much, per pupil, as non-rural schools in 2020-21. Local funding for rural schools was lower than non-rural schools by 33%, but state and federal funding for rural schools is higher than in non-rural schools by 7% and 16%, respectively, making up most of the difference in per-pupil funding. North Carolina has the second largest population of rural students in the country, behind only Texas. By prorating school-level per-pupil expenditures at the school level according to the proportion of students in each racial/ethnic subgroup, it is possible to calculate per-pupil expenditures by race/ethnicity. In 2020-21, per pupil expenditures were highest for American Indian and Black students, and lowest for Asian/Pacific Islander and White subgroups. We encourage state, district, and school leaders to examine these data and look for […]
2022 Spotlight On Series: Student Learning During the COVID-19 Pandemic STUDENT ACHIEVEMENT BEFORE AND AFTER THE PANDEMIC In March 2020, education in North Carolina changed dramatically as schools across the state were temporarily closed and then moved to remote learning in response to the COVID-19 pandemic. Summative assessments were eliminated in 2019-20, but 2020-21 assessment data, compared with the pre-COVID 2018-19 data, give us a glimpse into the impact of these significant learning disruptions. As expected, student proficiency rates fell for students in all grades and in almost every subject. Declines in student achievement varied across student subgroups and were greatest amongst the most at-risk students, including those who experienced homelessness and economically disadvantaged students. Meanwhile, high school students’ achievement appeared to be impacted somewhat less than their elementary and middle school peers. Scores on high school End-of-Course assessments and ACT scores declined, but not as much as in the lower grades. Note: The ACT is a cumulative test that measures learning across several years. THE IMPACT OF LOST INSTRUCTIONAL TIME In March 2022, NC DPI’s Office of Learning Recovery and Acceleration released the COVID-19 Impact Analysis of Lost Instructional Time report, which assesses the extent to which students’ learning trajectories were altered by factors related to teaching and learning during the pandemic. In the charts below, a negative effect size indicates that students made less progress than expected in a typical year of schooling. Student progress was negatively impacted at all grades and in all subjects, except English II, which is typically taken in 10th grade. Following the initial Lost Instructional Time Report, NC DPI issued a report that quantifies the interventions necessary for students to fully recover learning from the pandemic. Using research-backed methods that allow for the conversion of test score differences to units of school time, DPI estimated the number of months of intervention it will require students to recover learning lost during the pandemic. The additional learning time necessary ranged from 2.25 to 15.25 months and was higher in math than in reading. THE IMPACT OF LOST INSTRUCTIONAL TIME BY STUDENT SUBGROUP While the learning of all groups of students was diminished by the pandemic, some groups saw greater impacts than others, including American Indian students, Black students, and economically disadvantaged students. Students attending high-poverty schools were also disproportionately impacted by the pandemic. THE IMPACT OF REMOTE LEARNING Students who returned to the classroom for face-to-face learning earlier performed better than students who experienced higher numbers of remote learning days. The negative impacts of remote instruction were broad and pervasive, but most severely affected learning in grades 3 and 4 reading and in middle grades math. In August 2022, DPI issued a separate report examining the effect of home Internet access on student learning. DPI found that, in 2017-18, students with greater access to the Internet at home were more likely to meet or exceed growth expectations than students with less home Internet access. In 2020-21, the positive impact of home Internet access was greater in magnitude, signaling that reliable Internet access played a more prominent role in student success during the pandemic. AND THERE’S MORE To learn more about the impact of the pandemic on student learning, as well as DPI’s efforts to assess those impacts, check out these links: NC DPI’s Impact Analysis of Lost Instructional Time full report. A video that explains effect size. A primer summarizing the key findings of the Impact Analysis of Lost Instructional Time report. NC DPI Office of Learning and Recovery and Acceleration Research and Recovery Roundup blog. A white paper interpreting the results of the Impact Analysis of Lost Instructional Time report. A white paper quantifying necessary interventions for students to recover learning. A white paper highlighting the impact of home Internet access on student progress in English-Language Arts during the pandemic. Sources: NC DPI Accountability Data Sets and Reports, NC DPI COVID-19 Impact Analysis of Lost Instructional Time, NC DPI White Paper: Recovery Interventions Require Effects Equivalent to Months of Additional School Time, NC DPI White Paper: Rural-urban differences in ELA progress and home internet access during pandemic