An Examination of NAEP Student Proficiency, by Free & Reduced Price Meal Eligibility (2009 to 2024)
An Examination of NAEP Student Proficiency, by Free & Reduced Price Meal Eligibility (2009 to 2024)
BEST NC Launches Updated School Spending Data Explorer for 2022-23

An Examination of NAEP Student Proficiency, by Free & Reduced Price Meal Eligibility (2009 to 2022)

An Examination of NAEP Student Proficiency, by Free & Reduced Price Meal Eligibility (2009 to 2022)
2023 Spotlight On Series: Advanced Math Course Access in North Carolina

Advanced Math Course Access in North Carolina Note: The following blog contains excerpts from an essay published in The 74 Million in November 2023, co-authored by Dr. Jonathan Plucker, Professor of education and Director of the Education Policy Program at Johns Hopkins University and Brenda Berg, President and CEO of BEST NC. In today’s economy, where an increasing number of jobs require strong math and data analysis skills, it is imperative for high school and college students entering the workforce to have access to and experience in higher level math courses. In fact, research shows that students who enroll in and complete advanced math courses are more likely to be ready for post-secondary education than students who do not. However, in many states and districts across the country, qualified students often do not receive access to advanced math courses. This happens more frequently to economically disadvantaged students, leading to inequitable access to challenging math coursework for low-income students. North Carolina’s Advanced Math Coursework Policy In 2017, the News and Observer published a series of investigative reports called the “Counted Out” series, examining advanced math placement practices in several large school districts in North Carolina. The analysis found that qualified economically disadvantaged students were less likely than their affluent peers to be placed in advanced courses, despite having similar levels of preparedness. In 2018, partially in response to the “Counted Out” series, the North Carolina General Assembly passed legislation requiring all students who score at the highest level on their math End-of-Grade tests to be placed into an advanced learning opportunity (grades 3-5) or advanced math course (grades 6 and up) during the following school year. This was the first law in the nation to require automatic enrollment in advanced courses for highly qualified students. Note: Parents may still opt their child out of the advanced math course if they believe it is not the right placement for them. NC DPI estimates that, immediately after passage of the law, as many as 8,000 students in grades 6 and above were placed in advanced courses to which they otherwise would have been denied access. Specifically, 2,100 rising 8th graders were moved up into Math I – an algebra-focused course typically taken in 9th grade – during the summer of 2018 after having been originally placed in regular or even remedial 8th grade math. This means that thousands of qualified middle schools students received access to a high school level math course, and therefore, a faster track to college prep math courses, that they would have otherwise not had access to. Although not all districts were initially supportive of the policy, several have since reported that the policy helped to accelerate learning for high-performing students that had been overlooked, including students in key demographic groups like English Language Learners. In 2019, the law was updated to require an annual report on implementation, including capturing how the demographic makeup of advanced math course enrollment is altered by the policy. North Carolina’s Advanced Math Coursework Policy The most recent report on the implementation of the state’s advanced math coursework policy reveals several important trends. In 2022-23, 92% of students in grades 6 and above who scored at the highest level on their prior year exam were placed in an advanced math course (45,003 out of 49,154). While 92% represents a high level of advanced math coursework participation for students with demonstrated aptitude in math, it also raises serious questions about why nearly 10% of qualified students are not being placed, including whether or not the cause is a decision to opt-out by their parents. Disaggregated data also reveal gaps in placement across demographic groups with 92% of White students placed, 88% of Black students, 90% of Hispanic students, and just 78% of American Indian students. Sources: North Carolina General Assembly – Joint Legislative Oversight Committee; NC DPI (Data Request) Placement rates also vary across North Carolina’s school districts, ranging from 33% in Columbus County to 100% in 18 districts. It is worth investigating the reasons for the inter-district variation in advanced math placement rates of qualified students. Source: NC DPI (Data Request) Placement in advanced math also varies significantly by grade, with 6th, 7th, and 12th grade placements rates lower than those for 8th, 10th, and 11th. Lower rates at the middle school grade levels suggest that not all districts offer advanced courses to students in these grade levels. There are a host of possible reasons; for instance, in smaller and more rural schools, there may be too few qualifying students to offer these courses. This is also a topic worth investigating further. Source: NC DPI (Data Request) What Comes Next? These initial results suggest that the primary goal of the law is being fulfilled: A significant majority of North Carolina’s mathematically talented students are being appropriately placed into advanced math courses in their public schools. But the data also suggest there is considerable work to be done: We need to learn about the remaining barriers that prevent districts from offering advanced math to qualified students in order to strengthen implementation. We also need to determine the impact this law has had on overall math outcomes for NC public school students.
Best Practices in Teacher Pay: State Position Allotments and Hidden Teacher Pay Inequities

Best Practices in Teacher Pay: State Position Allotments and Hidden Teacher Pay Inequities A comprehensive, professional compensation plan includes layered pay strategies that build on one another to ensure the recruitment and retention of a high-quality workforce. This is the twelfth in a series of blogs highlighting best practices in teacher pay featured in detail in BEST NC’s report, Teacher Pay in North Carolina: A Smart Investment in Student Achievement. State Position Allotments The classroom teacher allotment is – by far – the largest single state allotment: salary and benefits for instructional personnel represent approximately 58% of total state funding for education. In North Carolina, the state allots teaching positions to each school district based upon the number of students in each grade, according to ratios set by the General Assembly. When a school district hires a teacher, the state provides the district with the teacher’s state base pay, depending on where the individual falls on the state salary schedule. In concept, the position allotment system is intended to provide equal access to teachers for all schools and districts – because the state funds positions rather than dollar amounts, districts can hire teachers without regard to how much the teacher will cost to employ. The reality is, however, that teachers are not evenly distributed across the state, and they can choose to which schools they want to apply. More experienced and qualified teachers are concentrated in more affluent schools and districts, while schools with greater percentages of economically disadvantaged students have applicant pools that are less experienced and have lower qualifications. Researchers call this phenomenon teacher sorting. So, while a district can use the allotment model to hire any teacher without regard to cost, many schools simply don’t have access to highly qualified teachers. To put this impact into simple terms, consider two schools, each employing 100 teachers, and an applicant pool of 200 total teachers — 100 experienced teachers making $60,000 and 100 beginning teachers making $40,000. If the first school hires all 100 experienced teachers and the second school hires the remaining 100 beginning teachers, the first school will have a $6 million teacher budget, while the second school will have a $4 million teacher budget. This hypothetical example demonstrates that an equal number of teachers does not always mean equal value. A 2016 study by the Program Evaluation Division of the North Carolina General Assembly study found that teacher sorting is exacerbated by the state’s position allotment system. The study found that the allotment system enables wealthier districts that offer higher salary supplements and greater supports for students, teachers, and families to take advantage of applicant pools rich with experienced, National Board Certified teachers to accumulate greater numbers of highly qualified teachers, depriving hard-to-staff schools with more economically disadvantaged students of access to these educators. This pattern is visualized in Exhibit 2 below. In addition to teacher sorting – a teacher’s choice to apply to more desirable schools and districts – the differences in the strength of teacher applicant pools can also result from regional variation in teacher talent, which helps explain why the inequities are not just an ‘urban vs. rural’ or ‘affluent vs. poor’ phenomenon. A region that has a more robust supply of educators will employ the more experienced and National Board Certified teachers, thus increasing the per-teacher cost of their workforce. This significant funding inequity that is embedded into North Carolina’s education system comes into clearer focus when comparing a school district’s average state-funded teacher salary to the statewide average for state-funded teacher pay. Below are two examples, one urban and one rural. With 420 state-funded teachers in Hoke County and 7,719 in Charlotte-Mecklenburg Schools, these districts received $1,948,997 and $3,874,047 less funding, respectively, in 2020-21 than if they had received dollar allotments for teachers based on the average state pay. With that additional funding, Hoke County could, for example, pay every teacher $4,638 more, making themselves more competitive with surrounding districts that have higher salary supplements, or could use a portion of those funds to establish significant financial incentives to attract teachers into hard-to-staff schools and subjects. When districts’ state-funded teacher pay advantage or penalty is plotted, there are distinct geographical patterns (see Exhibit 4 below). However, there is no guarantee that a district that is benefitting from this model today will continue to have that advantage in the future. These patterns may shift over time as the teacher pipeline changes in different parts of the state, e.g., as veteran teachers retire and are replaced with less experienced teachers.
BEST NC Launches Updated per Pupil Expenditure Data Explorer 2023
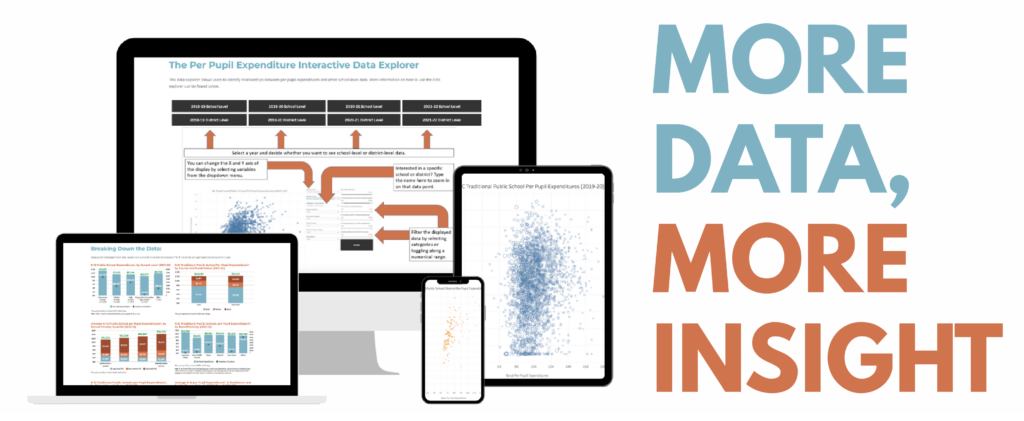
BEST NC Launches Updated per Pupil Expenditure Data Explorer The latest update now includes data through the 2021-22 academic year. BEST NC is pleased to announce the 2023 update of its per Pupil Expenditure (PPE) Data Explorer and landing page, designed to facilitate the understanding and exploration of North Carolina’s school-level spending data and its relationship to other key education indicators. The updated tool features school- and district-level expenditure data from the 2018-19 through 2021-22 school years, including both traditional public schools and public charter schools. The tool offers the ability to examine longitudinal changes in spending and school performance at the school and district levels. ABOUT THE TOOL The federal Every Student Succeeds Act of 2015 requires each state education agency to release school-level per pupil expenditure data. 2018-19 expenditure data was released in 2020 marking the first time spending data were made available at the school level in North Carolina and uncovering trends that have been masked by district-level data. BEST NC’s web-based Per Pupil Expenditure Data Explorer allows education stakeholders to explore per pupil funding trends across individual schools, within districts, and across districts in North Carolina. Educators, school leaders, parents, policymakers, advocates, and other members of the public can use this tool to examine education spending and student outcomes for similar schools based on size, grade level, geography, percent students with disabilities, poverty, and more. By comparing schools with similar characteristics, school leaders and other education stakeholders can identify schools with strong student performance, given their level of funding and the characteristics of their student body. Promising or innovative practices from these schools might then be examined to help improve teaching and learning in similar schools. For example, users can narrow the analysis to include all elementary schools where at least 60% of students qualify as economically disadvantaged, and then examine schools with strong student growth numbers and modest per pupil expenditures. Note: Student performance metrics are unavailable for the 2019-20 school year, as all end-of-year tests were canceled due to the COVID-19 pandemic. Additionally, in 2020-21, students took end-of-year tests, but North Carolina was granted a waiver from federal accountability requirements, meaning that while student proficiency numbers were available other school-level metrics – such as School Performance Scores, School Achievement Scores, and School Growth Scores – were not. In 2021-22, student- and school-level performance metrics are available and included in the Tool. The PPE Interactive Data Explorer can be accessed on BEST NC’s PPE landing page alongside summary analyses (see below) and additional resources. INSIGHTS AND TRENDS FROM THE PER PUPIL EXPENDITURE DATA EXPLORER: KEY FINDINGS ABOUT NORTH CAROLINA’S PUBLIC SCHOOLS With the help of BEST NC’s Per Pupil Expenditure Data Explorer, education leaders and other stakeholders can explore trends in school spending at the school level. Several insights are highlighted on the PPE landing page. Examples of these findings can be found below. Per Pupil Expenditures and Economically Disadvantaged Students: Generally, total per pupil expenditures in North Carolina are higher in schools with greater numbers of economically disadvantaged students. In 2021-22, about $3,000 more was spent per pupil in schools in the highest-poverty quartile, as compared with schools in the lowest-poverty quartile. In a school with 500 students, this equates to around $1.5 million in additional resources. In this way, North Carolina defies national trends in which lower income schools generally receive less funding than more affluent schools. It should be noted, however, that a relatively equitable distribution of education funding does not mean that overall funding levels are necessarily adequate. Source: NC DPI School Report Cards Note that expenditures of local funds are inversely correlated with poverty (see graph above), so funding equity in most districts is a function of state and federal funding allocations. Per Pupil Expenditures and Student Performance: Schools with lower student achievement have higher per pupil expenditures than schools with lower student achievement. These differences are driven by higher levels of state and federal funding. Meanwhile, there appears to be little correlation between levels of student growth and total per pupil expenditures. Sources: NC DPI School Report Cards; NC DPI School Performance Grades . Because School Performance Grades (SPG) are driven mostly by student achievement and per pupil expenditures are higher in schools with lower achievement, when per pupil expenditures are sorted by SPG, the highest per pupil expenditures are seen in schools with a SPG of D or F. Sources: NC DPI School Report Cards; NC DPI School Performance Grades Impact of COVID Relief Funding on Total Per Pupil Expenditures: Total per pupil expenditures (including state, federal, and local funds) increased by $2,480 per pupil, or 25%, over the four-year period from 2018-19 to 2021-22. Fifty-eight percent (58%) of this increase was due to an influx of federal COVID relief dollars. Since March 2020, North Carolina’s K-12 public schools have received over $6 billion in COVID relief funds, mostly from the federal government. Schools and districts spent $90 million in COVID relief funds during the 2019-20 school year, $660 million during the 2020-21 school year, and over $2 billion during the 2021-22 school year. Schools have until September 30, 2024 to spend the remaining COVID relief dollars. While COVID relief fund expenditures are not available at the school level, district-level data reveal that more COVID relief funds were spent by districts with higher percentages of students identified as economically disadvantaged. This is because COVID relief funding was allocated according to the federal Title I funding formula, which is designed to support schools with high concentrations of students in poverty. In 2021-22, districts in the highest poverty quartile had 54% higher COVID relief funding expenditures, per pupil, than districts in the lowest poverty quartile. Sources: NC DPI School Report Cards; NC DPI COVID Funds . Per Pupil Expenditures in Traditional Public Schools and Public Charter Schools: In 2021-22, average per pupil expenditures were $12,215 in traditional public schools and $11,233 in […]
Best Practices in Teacher Pay: Spotlight on Teacher Retirement Benefits
Best Practices in Teacher Pay: Spotlight on Teacher Retirement Benefits A comprehensive, professional compensation plan includes layered pay strategies that build on one another to ensure the recruitment and retention of a high-quality workforce. This is the eleventh in a series of blogs highlighting best practices in teacher pay featured in detail in BEST NC’s report, Teacher Pay in North Carolina: A Smart Investment in Student Achievement. The previous blog in our teacher pay provides an overview of trends in teacher health care and retirement benefits and delves into how health care benefits for North Carolina teachers have changed over the past 10 years. This blog examines teacher retirement benefits, both nationally and in North Carolina. Retirement Benefits Nationally, 90% of all public school teachers are enrolled in defined retirement benefit plans, wherein retirees are paid a guaranteed pension benefit based upon a predefined formula, often based on variables like years of experience and highest salary level. In 2021-22, 36 states used a defined benefit plan as their default option, including North Carolina. Other retirement options offered by states include: Direct contribution plans, in which teachers and employers each contribute a percentage of a teacher’s salary into an individual account and the funds are invested. The value of the account fluctuates depending upon the performance of the underlying investments. Cash balance plans, in which teachers contribute a percent of their salary to retirement. The state manages the funds and guarantees a certain rate of annual interest, with higher rates of guaranteed interest for longer-tenured teachers. Hybrid plans, which incorporate features from defined benefit and defined contribution plans. In most states that use defined benefit pension plans, pension formulas consider the retiree’s years of experience and highest salary level (often an average over a series of years). In North Carolina, teachers are eligible to begin collecting pension payments at 30 years of experience, regardless of age; at 25 years of experience, if age 60 or older; or at 5 years of experience, if age 65 or older. Since most teacher salary schedules require decades of experience before reaching the highest salary bands, the longest-tenured teachers receive a much better return on their pension contributions than teachers who work for a lesser number of years. Source: MetLife . In the defined benefit plans offered by most states, the retirement benefits drawn down by teachers are not tied to teachers’ contributions to the system. The result is that, while employer contributions to teacher retirement plans continue to increase, the majority of those contributions are going to pay down existing pension obligations, and states are cutting benefits in order to make pension plans more sustainable. This certainly holds true in North Carolina, where 65% of employer pension contributions for teachers working in North Carolina’s schools go to paying down existing obligations to current retirees, with just 35% going to active teachers’ future retirement benefits. At the same time, retirement contributions as a percentage of teacher salary have increased from 9% to 16% since 2012, mainly due to the state’s efforts to keep pace with its ongoing teacher pension plan obligations: Conventional thinking suggests that teachers – and public employees more generally – enter the profession knowing that they will accept lower salaries in exchange for increased benefits. However, pensions represent a significant portion of all benefits and the greatest pension benefits accrue to the small subset of teachers who stay in the profession long enough to retire. In fact, research finds that about half of all new teachers leave the profession without qualifying for a pension benefit at all, despite having contributed to the retirement system. Additionally, under the existing system, retirement eligibility criteria act to incentivize retention for teachers between 15 and 25 years of teaching (those teachers who are on track to collect the largest pension benefits) and incentivize retirement for teachers between 25 and 30 years into their career (when most career teachers are first eligible to receive pension payments). This can be visualized by examining the number of state-funded teachers in North Carolina, sorted by years of experience, and noticing the dramatic increase in attrition at 27 to 29 years of experience: Perceptions of Retirement Benefits Despite teacher retirement benefits being typically more generous than those of private-sector employees, research shows that teachers have inconsistent knowledge about their retirement benefits. A recent study of a nationally representative sample of teachers found that 45% could not identify what type of retirement plan they had, and that many teachers struggled to identify how much they are contributing to their plans, their retirement eligibility age, and the duration of their retirement benefits. Late-career teachers (20 or more years of experience) were much more adept at answering these questions, likely because they are closer to receiving retirement benefits. However, knowledge gaps of early- and mid-career teachers suggest that they may not know the extent to which retirement benefits disproportionately accrue to teachers who stay in the profession longer. Perhaps unsurprising given teachers’ inconsistent knowledge of their retirement benefits, when asked how they prioritize salaries and pensions, a plurality of teachers indicated that they would prefer higher salaries at the cost of lower pensions. In 2018’s Voices from the Classroom survey, an annual, nationally representative survey of America’s teachers, 43% of teachers indicated that they would prefer a higher salary and a smaller pension, compared to 26% who would prefer a lower salary and a larger pension, with 31% unsure. These survey data indicate an openness among teachers to a restructuring of their total compensation package. One possible reform is the introduction of a defined contribution retirement plan option. Under a defined contribution plan, all teachers could see a benefit from their investment, even if they stay in the profession for a short period of time. This option could also reduce the state’s pension liability.
Best Practices in Teacher Pay: Teacher Benefits Overview & Spotlight on Healthcare Benefits
Best Practices in Teacher Pay: Teacher Benefits Overview & Spotlight on Healthcare Benefits A comprehensive, professional compensation plan includes layered pay strategies that build on one another to ensure the recruitment and retention of a high-quality workforce. This is the tenth in a series of blogs highlighting best practices in teacher pay featured in detail in BEST NC’s report, Teacher Pay in North Carolina: A Smart Investment in Student Achievement. Teacher Benefits Overview Teacher retirement and healthcare benefits costs have risen sharply in the past two decades and require increasing levels of investment from states in order to maintain benefits levels and to fully fund pension obligations. As the costs of these benefits rise, state funding that could otherwise be used to increase teacher pay is diverted. Chad Aldeman, policy director of Georgetown’s Edunomics Lab, notes that, after adjusting for inflation and rising student enrollment, total education spending in the United States increased by 29% from 1995 to 2015. Yet, despite this increase in education spending, inflation-adjusted teacher salaries actually decreased during this period. Aldeman attributes the stagnant teacher earnings amidst increased education spending to three factors: decreasing student-to-staff ratios, rising healthcare costs, and rising retirement costs. Exhibit 1 below illustrates the percentage change in the major components of teacher compensation compared to inflation. Between 2004 and 2021, teacher salaries roughly kept up with inflation, while healthcare costs, and especially retirement costs, significantly outpaced inflation. With more money paying for healthcare and the pensions of retired teachers, less is left over to support salary increases for teachers currently working in schools. In 2021-22, 28% of North Carolina teachers’ total compensation was in the form of benefits, compared to 17% in the private sector in the South Atlantic region. At this level, for every dollar spent on teacher salaries, nearly 40 cents must be spent on pensions and benefits. In other words, a $100 million investment in teacher pay actually costs the state $140 million. Healthcare Benefits Nationally, increases in health insurance premiums for all workers have outpaced increases in earnings for several decades. Since 2012, increases in health insurance premiums for single coverage have increased 18% after adjusting for inflation, while family coverage premiums have increased 21%. Unsurprisingly, as the costs of health insurance have gone up across the country, North Carolina’s contributions to teacher health insurance costs have increased by 13% (see Exhibit 2 above). Across the country, school districts pay a higher percentage of teacher health insurance premiums than do private employers. In an NCTQ study of 124 of the nation’s largest school districts, districts covered an average of 92% of health insurance premiums on individual plans, compared with 78% in the private sector. For family plans, the percentages are 79% and 67%, respectively. Given the rapidly increasing cost of health insurance and the fact that school districts tend to pay larger shares of health insurance premiums, rising healthcare costs increasingly compete with efforts to raise teacher salaries in North Carolina and across the country. UPCOMING: The next blog in our teacher pay series will highlight teacher retirement benefits.
Best Practices in Teacher Pay: Differentiated Pay Landscape and Best Practices
Best Practices in Teacher Pay: Differentiated Pay Landscape and Best Practices A comprehensive, professional compensation plan includes layered pay strategies that build on one another to ensure the recruitment and retention of a high-quality workforce. This is the ninth in a series of blogs highlighting best practices in teacher pay featured in detail in BEST NC’s report, Teacher Pay in North Carolina: A Smart Investment in Student Achievement. The previous two blogs (one and two) in our teacher pay series have examined how differentiated pay models can be used to increase access to highly effective teachers and improve student achievement in hard-to-staff schools and subject areas. In this blog, we provide an overview of the differentiated pay landscape in North Carolina and the United States and discuss the features of well-designed differentiated pay models. The Differentiated Pay Landscape In his report on the long-term trends in the quality of teachers, Sean P. Corcoran notes that “targeted pay increases in specific settings such as hard-to-staff subjects or schools have shown considerably more promise than merit–based bonuses.” Research shows that providing bonuses to recruit and retain teachers in hard-to-staff subjects and schools can significantly reduce teacher turnover in those positions, helping to reduce vacancies. Importantly, the size and sustainability of these efforts significantly affects their impact, which is covered below. Currently, 32 states incentivize teachers to work in high-needs schools using either additional compensation, loan forgiveness, or both. Meanwhile, 34 states offer additional compensation, loan forgiveness, or both to incentivize teachers to teach hard-to-staff subjects. In North Carolina, there are several ways in which pay incentives are used to recruit teachers to work in hard-to-staff schools and subject areas: Highly qualified graduates of in-state educator preparation programs are eligible for salary increases during their first three years of service. Eligible teachers working in low-performing schools are paid the salary of a fourth-year teacher during their first three years of service, and eligible teachers working in Special Education or STEM positions at any school are paid the salary of a third-year teacher for their first two years of service. While not a pay incentive, scholarship programs can be an effective recruitment incentive. The North Carolina Teaching Fellows program offers a forgivable loan of up to $4,125 per semester for those enrolled in participating educator preparation programs. Eligible candidates must pursue certification in Special Education or a STEM subject, and accelerated forgiveness is available for teachers who elect to teach in low-performing schools. Beginning in 2021, North Carolina invested $4.3 million to provide low-wealth and small county recruitment bonuses of $1,000 per teacher in school districts that receive funding through the Small County or Low-Wealth allotments. State funding must be matched 1:1 with local funding and signing bonuses may be up to $2,000 per teacher. . Each of these efforts is promising but has limited reach, with only a small subset of teachers affected. The Importance of Size and Sustainability The research makes clear that differentiated pay is most effective when it is significant, recurring, and sustainable. Many industries, including the military, offer substantial financial incentives to fill hard-to-staff positions. According to education think tank Public Impact, “The cross-sector research does not offer a concrete formula for determining the most effective level of hard-to-staff incentives. What is clear, however, is that employers across sectors are providing much larger incentives than the majority of hard-to-staff pay programs in education. Incentives between 10 percent and 30 percent of a teacher’s salary would be more in line with other sectors.” Differentiated pay for teachers in hard-to-staff schools and subjects can take many forms, including one-time bonuses, annual salary supplements, student loan forgiveness, tuition reimbursement, and mortgage assistance. State-level studies in North Carolina, Washington, Georgia, and Tennessee have documented the effects of these differential compensation strategies on teacher recruitment and retention in hard-to-staff schools and subjects. Key findings include: Stipends and bonuses in these state-level studies proved to be effective at retaining teachers across a number of contexts, including low-performing schools, high-poverty schools, and in hard-to-staff subjects. Recruitment and retention benefits of these programs generally last only as long as teachers are receiving the additional compensation, suggesting that one-time bonuses are not as effective as annual stipends or increases in base salaries. The amount of additional compensation matters. While not offering a precise amount, studies of salary bonuses and loan forgiveness programs for teachers working in hard-to-staff schools and subjects have found that larger bonuses or larger amounts of loan forgiveness are effective at recruiting and retaining teachers, while smaller bonuses and smaller amounts of loan forgiveness are less successful. The perception of sustainability also matters. An analysis of Washington, D.C.’s teacher evaluation and performance pay-differentiated pay framework (DC IMPACT) suggested that, in IMPACT’s first year, its effects on teacher performance and retention were significantly muted relative to those same effects in the program’s second year. As the program became more established and incentives were perceived to be more durable, the program began to more reliably produce changes in teacher performance and retention. An example of a differentiated pay policy aligned with best practices is underway in Alabama:
Best Practices in Teacher Pay: Differentiated Pay for Hard-to-Staff Subjects
Best Practices in Teacher Pay: Differentiated Pay for Hard-to-Staff Subjects A comprehensive, professional compensation plan includes layered pay strategies that build on one another to ensure the recruitment and retention of a high-quality workforce. This is the eighth in a series of blogs highlighting best practices in teacher pay featured in detail in BEST NC’s report, Teacher Pay in North Carolina: A Smart Investment in Student Achievement. The previous blog in our teacher pay series summarized research supporting the use of differentiated pay models to increase student access to highly effective teaches in hard-to-staff schools. This blog explores the potential for differentiated pay to do the same in hard-to-staff subject areas. The traditional step-and-lane teacher salary schedule, used in North Carolina and in most other states, pays teachers on two main factors: years of experience and level of education. While this pay structure creates a sense of objectivity and fairness, there is a notable disconnect between the uniform teacher pay structure and the wide variation in market demand for specific skills. For example, certain college degrees, specifically those in STEM subjects, yield higher salaries in the market, while the teaching profession rarely pays more for this high-demand expertise. Given that pay levels and pay parity matter when choosing a career, this disparity likely reduces the supply of STEM teachers, resulting in the higher vacancies we see in these subject areas. A recent examination of the most valuable college majors shows that average income levels of STEM majors like physics and computer science can be over $80,000 just five years after graduation, while majors like history, English, and the arts have median income levels in the $40,000 range. The exhibit below examines this in detail for recent UNC System graduates in key subject areas, and shows the national vacancy rates for teaching positions in related subject areas. Note: The average teacher salary estimate is likely an overestimate because it factors in the average local salary supplement, not the actual. Local salary supplements are often higher for teachers with more years of experience. Compare a teacher candidate with a STEM degree to a teacher candidate with a degree in history. Labor market forces provide candidates with a STEM background with significantly higher earnings potential over other degrees. With higher-paid professional options open to them, these graduates appear to be less apt to accept a teaching position. Researchers have confirmed that this at least partially explains the higher vacancy rates in subjects taught by STEM-educated candidates, to the detriment of schools being able to fill positions in STEM subjects. As with differentiated pay for hard-to staff schools, evidence suggests that differentiated pay for hard-to-staff subjects is an effective tool for recruiting and retaining effective teachers. This is an important tool to address elevated vacancy rates in subjects that are traditionally difficult to fill, such as STEM and special education.