
20-Year Enrollment Trends in
North Carolina Schools
Published 2024 | BEST NC
North Carolina is the 9th largest state in the nation with the 8th highest population growth between 2000 to 2020. Much of the growth can be attributed to in-migration, not births, with the largest increases in urban areas, including Charlotte and the Research Triangle area. However, population growth has not been uniform across the state, as many counties face decreasing populations.
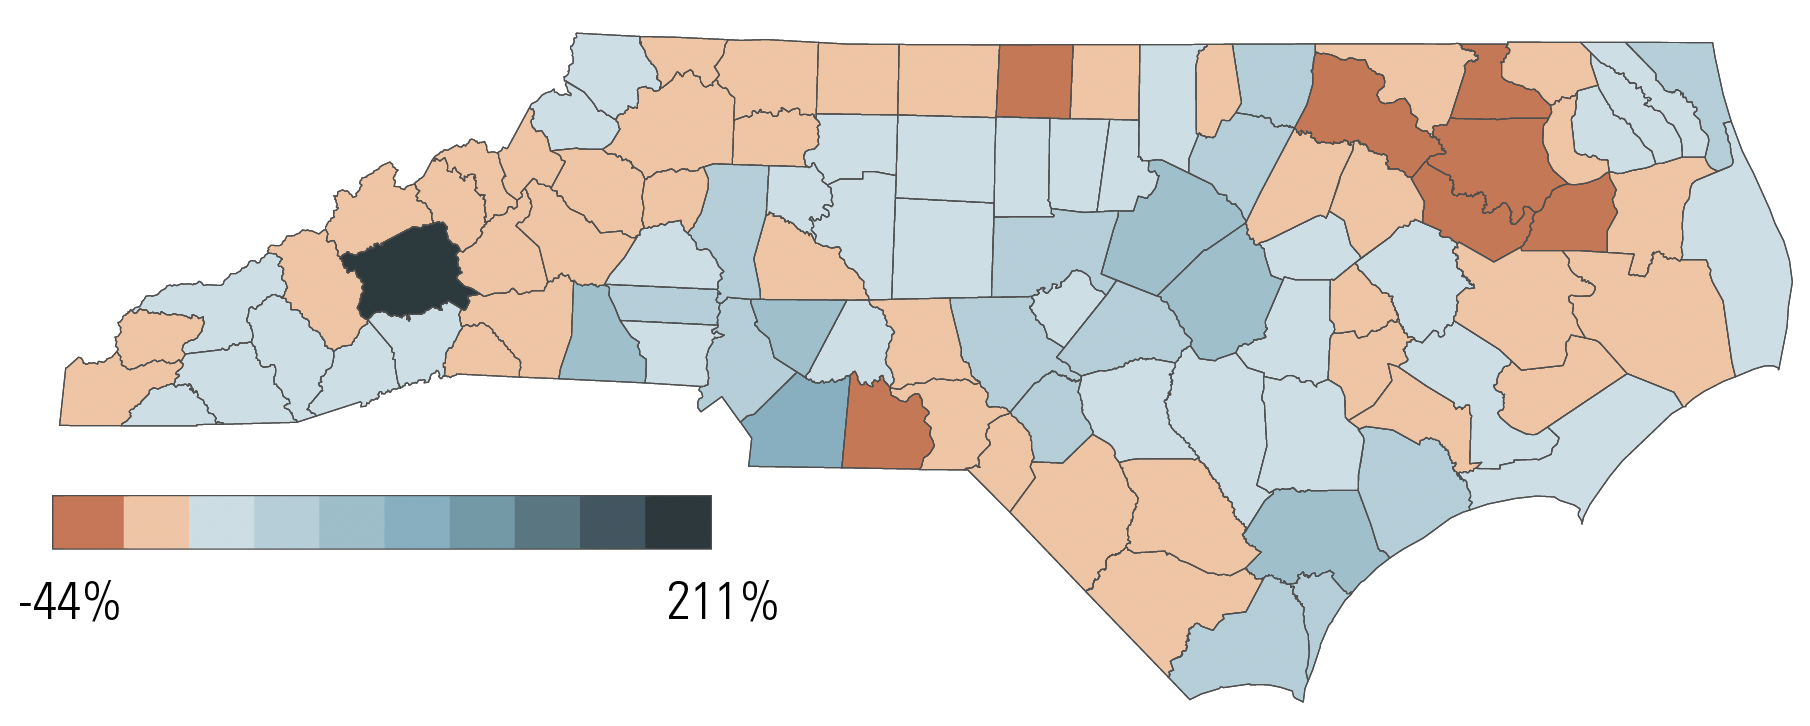
Population changes directly impact student enrollment in K-12 public schools, private schools, and homeschools. From 2004 to 2023, 55 counties saw an increase in total K-12 school enrollment, while 45 counties saw a decrease in enrollment. The percentage change in enrollment ranged from a 211% increase in Buncombe County to a 44% decrease in Washington county.
Figure 1: 20-Year Change in Total School Enrollment (2004 to 2023)
|
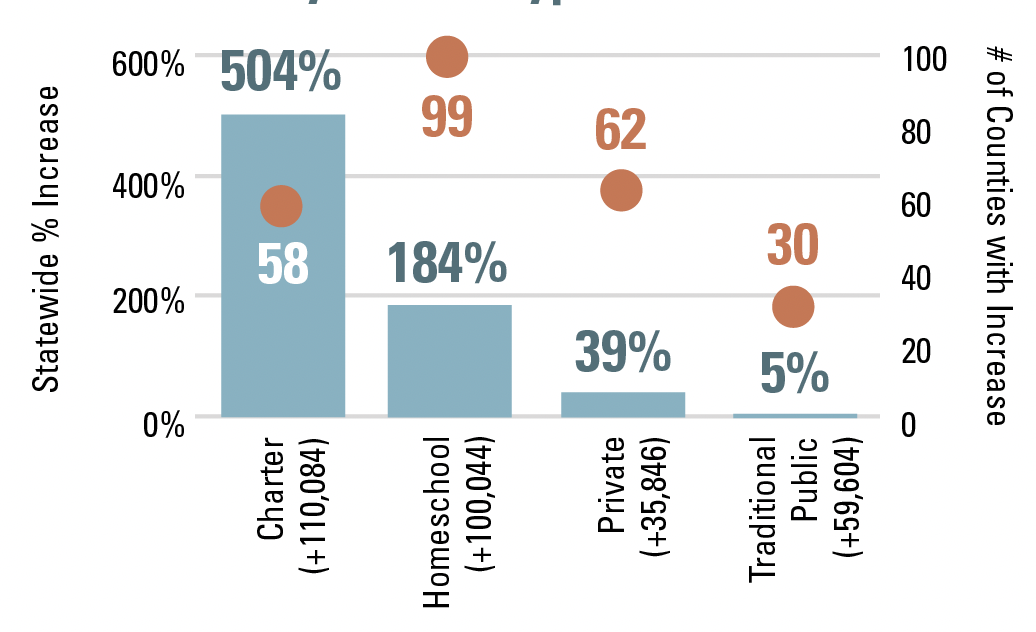
Traditional public and public charter schools served 84% of all K-12 students in 2022–23, down from 90% in 2004. |
From 2004 to 2023, homeschool enrollment increased by 184% or 100,044 students statewide, with increases in nearly all counties. Homeschool enrollment has now surpassed total private school enrollment which increased by 39% or 35,846 students during this period. |
Figure 2: Percentage Enrollment Increase and the Number of Counties with Increasing Enrollment, by School Type (2004 to 2023) |
Within public schools, traditional school enrollment has grown 4%, from 1,318,529 to 1,378,133 students (up 59,604 students) since 2004. Charter school enrollment increased by 504% or 110,084 students, with charter school enrollment increasing in nearly twice as many counties as traditional enrollment. The chart to the left shows the percentage increase statewide by school type, as well as the number of counties that saw growth in each school type. Of the counties with increasing enrollment, 21 saw gains across all four school types. |
NC DPI Statistical Profile, Tables 1 & 3; NC Home School Statistical Summary (Years 2004–2023); NC Private School Statistical Summary (Years 2004–2023)
About This Series
This post is part of BEST NC’s 2024 Facts & Figures: Education in North Carolina Spotlight On: series. View the full report at NCEdFacts.org or visit BESTNC.org.