
North Carolina’s Categorical Allotments for K–12 Education
Published 2026 | BEST NC | Section: Finance (Pages 46–47)
Figure 1 – State K–12 Education Funding Purpose (2025–26)
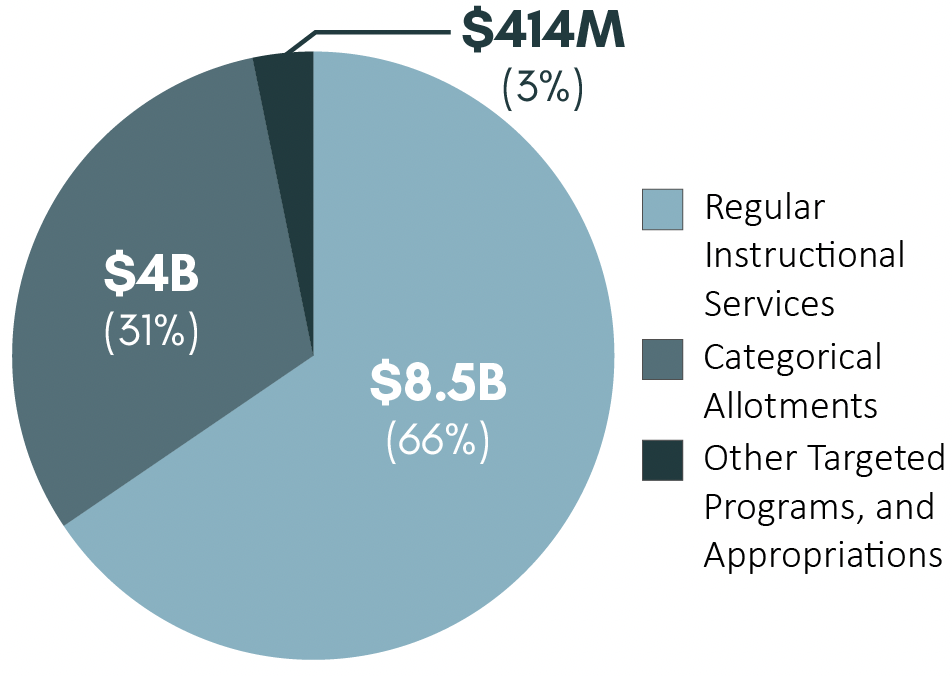
The total state investment for K–12 public school funding is $12.8 billion. Of that, around 66% of this appropriated budget is for resource-based items such as general administration, teachers, other personnel, and related services ($8.4 billion).
The second largest part of the K–12 public school funding is Categorical Allotments, which make up about 31% of the budget ($4 billion). Categorical Allotments designate state funding to target specific student or district needs, such as supplementing low wealth counties, disadvantaged students, or academically gifted students.
The remaining approximately 3% ($414M) are for various targeted programs, grants, and other targeted appropriations like AP/IB testing and Cooperative Innovative High Schools.
A majority of the Categorical Allotments (64%) are composed of eight categories based on specific student or district needs. Exceptional Children account for nearly half of these funds, about $1 billion. The smallest Categorical Allotment is the Small County Supplemental Funding for small and sparsely populated districts at approximately $48M (2%) (see Figure 2).
Figure 2 – Share of Total State Education Categorical Funding, by Program Category (FY2025–26)
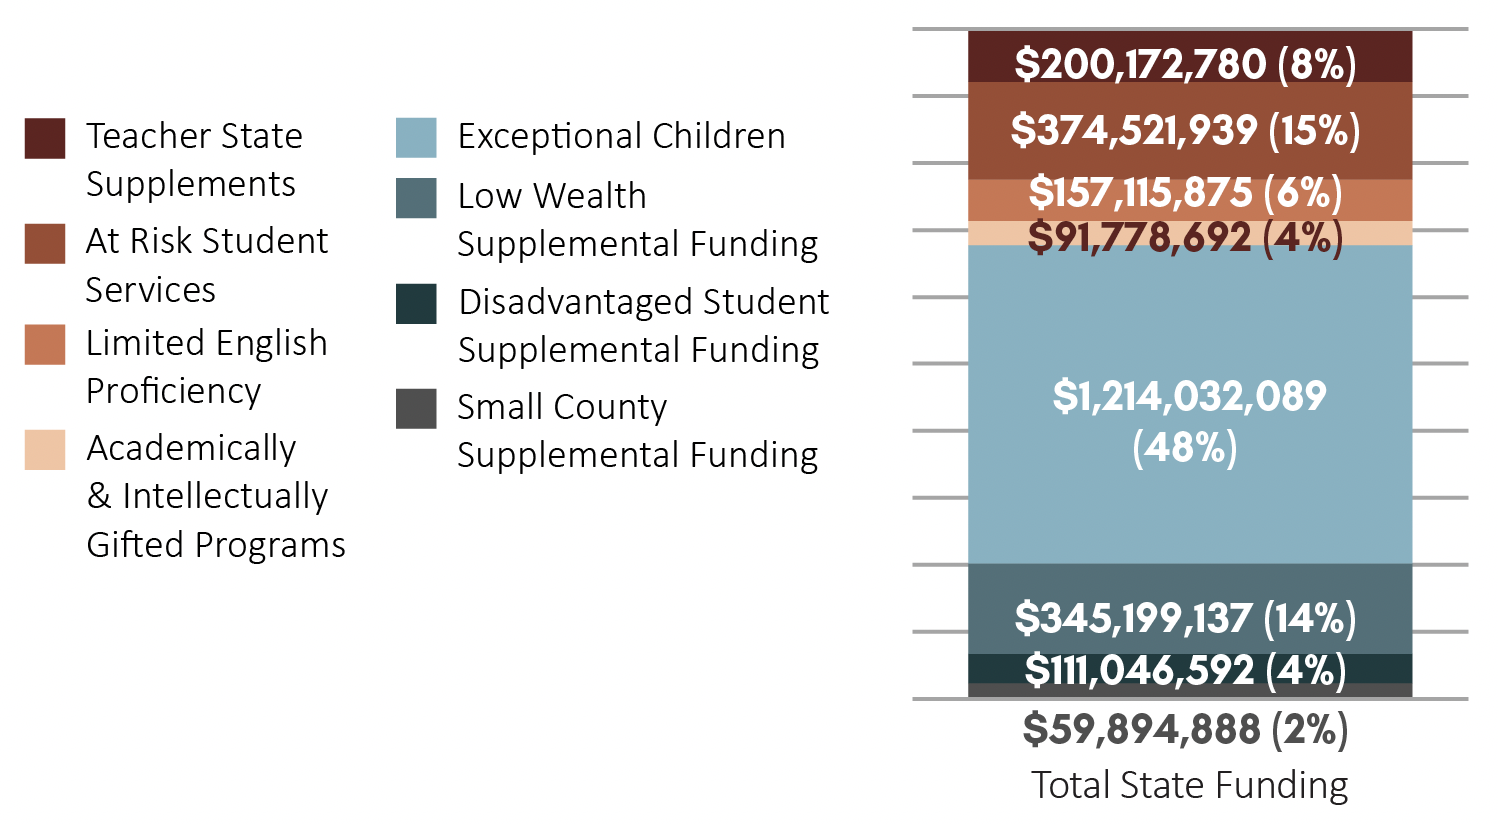
Categorical Allotment Types
Exceptional Children ($1.2 billion) receive the most funding because of compliance with legal mandates, such as the federal Individuals with Disabilities Education Act (IDEA). North Carolina has a 13% cap on special education funds, meaning the state will only pay districts for whichever is smaller: the actual number of students identified with disabilities or 13% of the district’s total student population.
Other student-weighted Categorical Allotments include Academically and Intellectually Gifted ($92M), At-Risk Student Services ($374M), and Limited English Proficiency ($157M) that serve specific groups of students. These programs remain relatively low and stable from year to year because they are formula-driven, capped, or tied to small student populations.
Teacher State Supplements ($200M in 111 districts), Low Wealth Supplemental Funding ($345M in 78 districts), Disadvantaged Student Supplemental Funding ($111M in all 115 districts), and Small County Supplemental Funding ($60M in 30 school districts). These funds are awarded based on criteria met at the district level, not individual student characteristics, to support the overhead of operating smaller or lower wealth districts.
Changes in Funding by Category from FY2016–17 to FY2025–26
The following graphic shows the ten-year trends for each of these allotments based on 2025 dollars:
Figure 3 – Per Pupil Funding Over Time for Categorical Allotments, in 2025 Dollars (2016 to 2025)
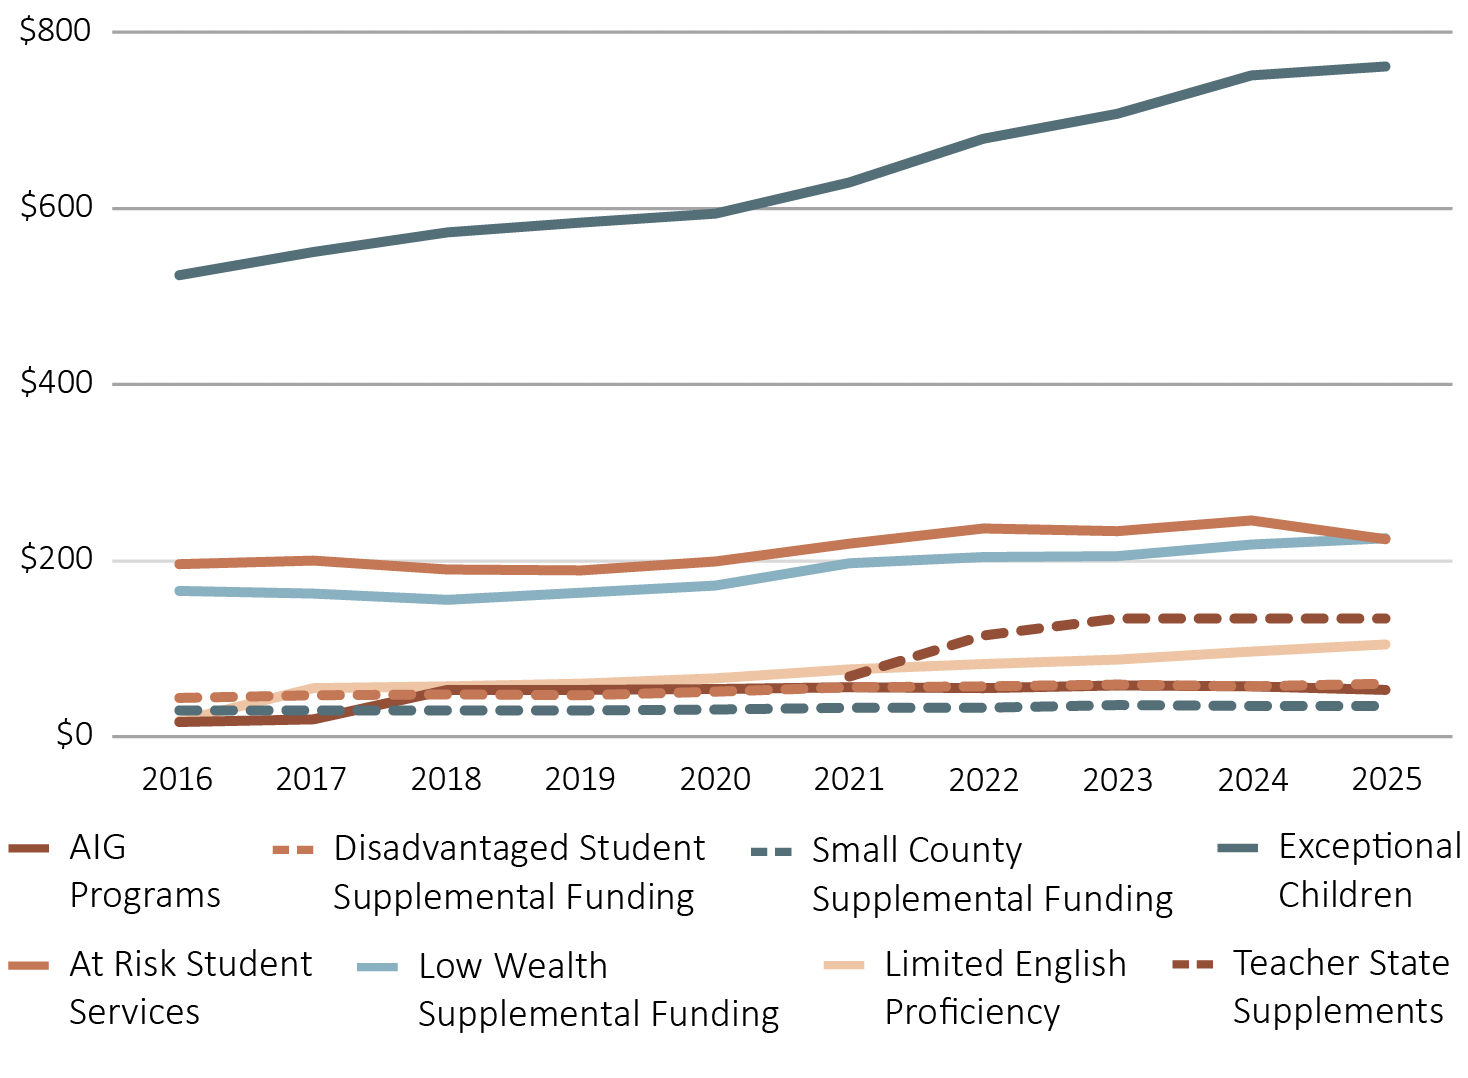
Differences in growth across programs largely reflect differences in their formulas. Programs like Exceptional Children and At Risk use formulas that scale with student need, which naturally produce steady increases over time. Low Wealth also grows modestly because its formula recalculates county wealth gaps annually. Exceptional Children (+45.4%) and At Risk Student Services (+14.5%) increased significantly because they use formulas that scale with student need, which produces steady increases over time.
In contrast, Academically and Intellectually Gifted, Limited English Proficiency, and Small County Supplemental Funding remain relatively flat because they rely on fixed ratios, caps, or static eligibility rules. Whereas, Teacher State Supplements grew significantly in its first few years (FY 2021–22 to FY 2023–24) because of increased budget investments.
NC DPI Final Pupils by Grade; NC DPI School Allotment Section, Allotment Data; NC DPI 2026 Highlights of the Public School Budget.
About This Series
This post is part of BEST NC’s 2026 Facts & Figures: Education in North Carolina Spotlight On: series. View the full report at NCEdFacts.org or visit BESTNC.org.